


 FxWirePro- Major Crypto levels and bias summary
  FxWirePro- Major Pair levels and bias summary
  EUR/USD Holds Bullish Tone Despite Pullback from Yesterday’s High
  FxWirePro: GBP/USD hits one-month high, scope for further upside
  FxWirePro: AUD/USD edges lower, but bullish outlook persists
  ETH Stands Alone Bullish; BTC, SOL, XRP, BNB Neutral
  FxWirePro- Woodies pivot (Major)
  GBPUSD, AUDUSD & NZDUSD Turn Extremely Bullish: Strong Positive Momentum Drives Major Pair Action Bias
  FxWirePro: GBP/NZD gains some upside momentum but still bearish
  GBPJPY Bullish on Consolidation: Holds Above 216 After 218 Top – Buy Dips at 217 Targeting 220
  FxWirePro- Woodies pivot (Major)
  JPY Action Bias: Extremely Bullish Surge Ignites Across NZD, GBP & AUD
  Crypto Major Pair Action Bias: ETHUSD Bullish as BTCUSD, SOLUSD & XRPUSD Stay Neutral
  Gold Loses Steam After Strong U.S. Retail Sales


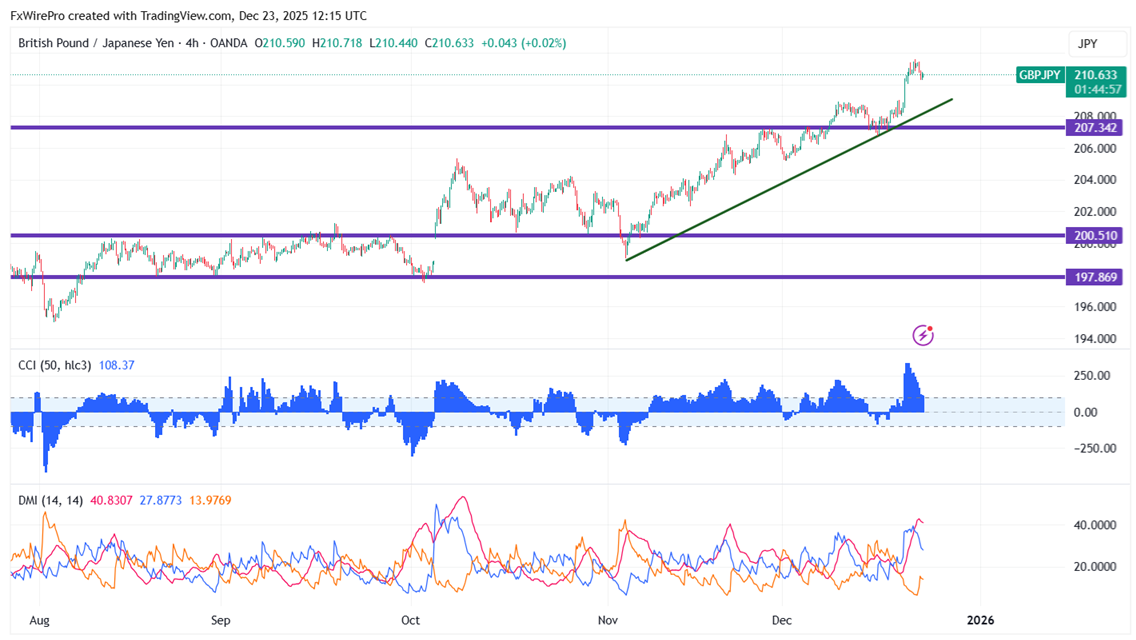
From 17 17-year high of 211.59, GBPJPY exhibited a little profit-booking. The intraday trend is downward as long as the resistance at 212 remains in place. As of publication, it is trading around 210.34 and has reached an intraday low of 210.29.
Oscillators and moving averages to forecast the trend of GBPJPY
CMP- 210.41
EMA (1-hour chart)
55-EMA- 210.45
200-EMA- 209.04
365-EMA- 208.16. The pair trades above short (55- EMA) and above long-term moving average(365 EMA and below 200 EMA).
Major Support- 210. Any breach below will drag the pair down 209.70/209/208.60/207.95/207.20/206.75.
Major resistance - 211.55. Any break above confirms minor bullishness, a jump to 212/212.60 is possible.
Indicator (4-hour chart)
CCI (50)- bearish
Average directional movement Index- Neutral. All indicators confirm a mixed trend.
It is good to sell on rallies around 210.78-80 with SL around 211.60 for a TP of 208.


