


 Crypto Major Pair Action Bias: ETHUSD Bullish as BTCUSD, SOLUSD & XRPUSD Stay Neutral
  FxWirePro:EUR/NZD extends fall, key support lies ahead
  FxWirePro :USD/JPY bulls loosen their grip a bit, dips to be bought
  BTCUSD Bullish Breakout: Clears 800-EMA After Consolidation, Buy Dips Toward $74,900
  NZDJPY Extremely Bullish Above 94: Broad NZD Buying Fuels Fresh Upside – Buy Dips at 93.70 Targeting 95
  ETHUSD Bullish Momentum: Follows BTC Above All EMAs, Buy Dips Near $1750 Targeting $2300
  FxWirePro- Major Pair levels and bias summary
  FxWirePro: AUD/USD remains buoyant, looks to extend gains
  GBPUSD, AUDUSD & NZDUSD Turn Extremely Bullish: Strong Positive Momentum Drives Major Pair Action Bias
  FxWirePro: EUR/AUD outlook weaker on renewed downside pressure
  FxWirePro- Major Crypto levels and bias summary
  AUDJPY Extremely Bullish Above 113: Strong AUD Fuels Fresh Rally – Buy Dips at 113 Targeting 115


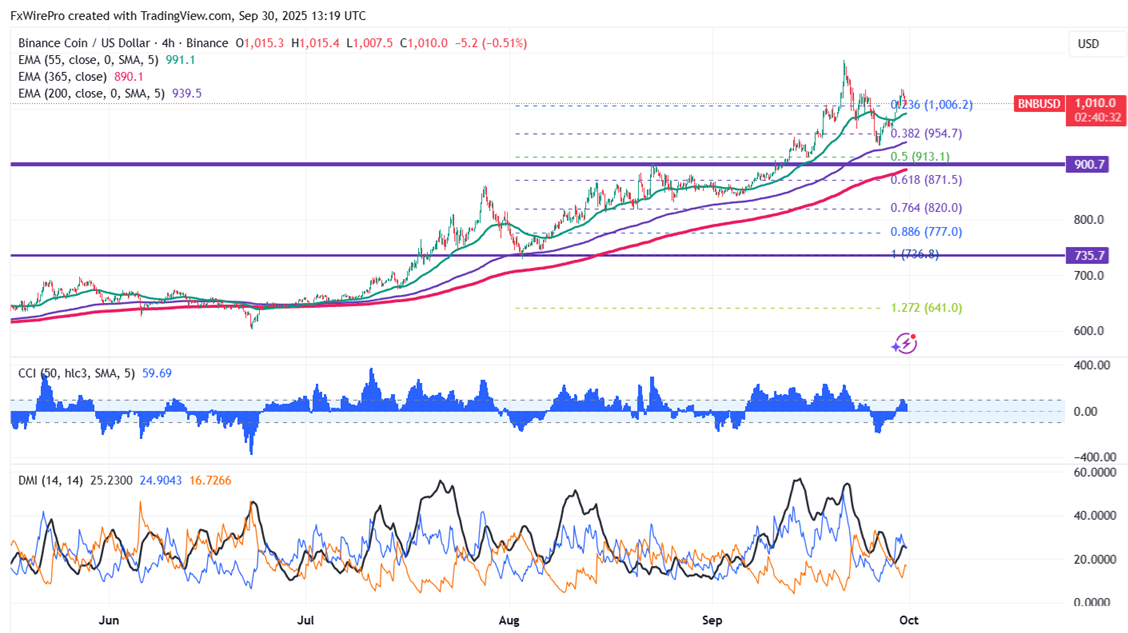
BNBUSD showed a minor profit-booking after forming a temporary top around $1034.90. It hits an intraday low of $1006.90 and is currently trading around $1009.50.
Oscillators and moving averages to forecast the trend of XMR
CMP- $1009.50
EMA (4-hour chart)
55-EMA- $990.40
200-EMA- $938.80
365-EMA- $889.40. The pair trades above the short and long-term moving averages.
Previous week low- $933.40 (Sep 26th low). Any breach below $930 will drag the pair down to $889/$870/$830.
Previous week high- $1051 (Sep 22nd high). Any break above $1051 confirms minor bullishness, a jump to $1087.10/$1100/$1130.
Indicators (4-hour chart)
CCI(50)- Bullish
ADX- above 20 showing neutral bias
Investment Strategy for BNBUSD
It is good to buy on dips around $980 with a stop loss around $930 for target profits of $1100.
BNBUSD found support around the 55-4H EMA and had a modest pullback above $1000. It is now trading around $1005.70 after reaching an intraday high of $1014.
Short-term trend remains bullish as long as support $872 (365 4H EMA) holds. It trades above the 55,200 and 365 EMA on the 4-hour chart. Near-term support is around $985; any close below targets $960/$928/$900/$865/$845/$810/$780/$755/$740. If the pair closes below $500, it potentially leads to further declines towards $400.
Immediate Resistance is at $1035.Any breakout above this resistance confirms bullish momentum and a jump towards $1050/$1100/$1150/$1200.
Indicators ( 4-Hour Chart)
Directional Movement Index: Bullish
CCI (50): Bullish
Trading Strategy
It is good to buy on dips around $980 with a stop-loss set at $930 and a target price of $1150/$1200


