


 Major JPY Action Bias — Extremely Bullish Setups in NZD/JPY, AUD/JPY and CAD/JPY
  Crypto Major Pair Action Bias: ETHUSD Bullish as BTCUSD, SOLUSD & XRPUSD Stay Neutral
  FxWirePro- Major Crypto levels and bias summary
  FxWirePro:EUR/NZD extends fall, key support lies ahead
  GBPJPY Stuck in Tight Range – Neutral Bias Persists Despite Bullish EMAs
  FxWirePro: GBP/USD advance after softer US inflation dims Fed rate hike bets
  FxWirePro- Major Pair levels and bias summary
  FxWirePro- Major Crypto levels and bias summary
  FxWirePro: USD/ZAR downside pressure builds, key support level in focus
  GBPJPY Bullish on Consolidation: Holds Above 216 After 218 Top – Buy Dips at 217 Targeting 220


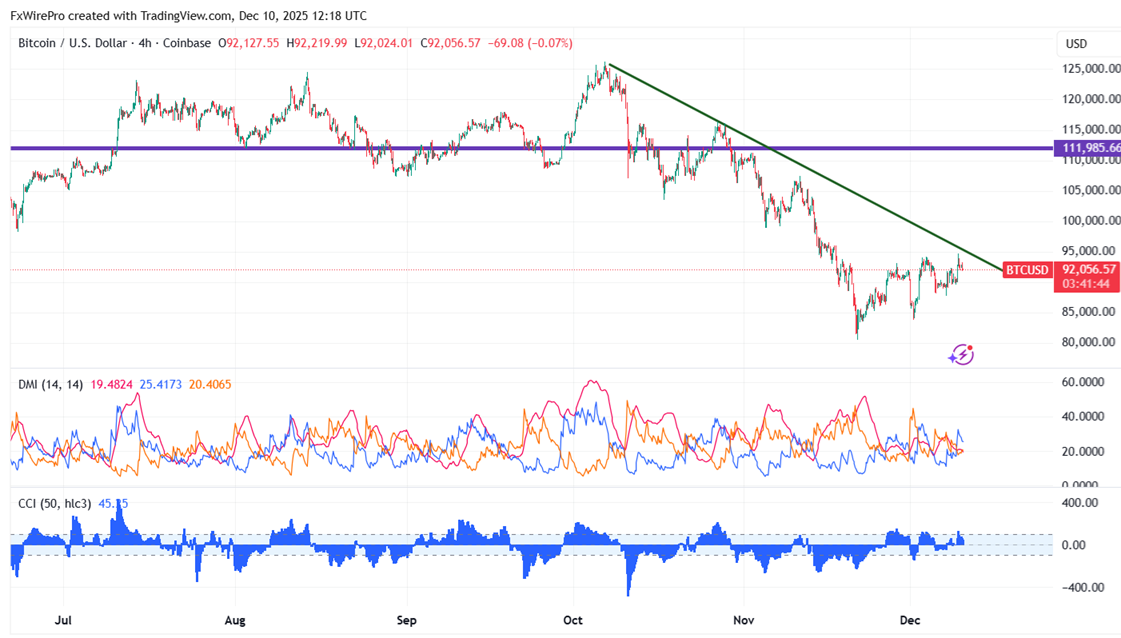
BTCUSD trades in a narrow range ahead of the Fed's monetary policy. It hit a high of $96460 yesterday, and at the moment, it is around $92048.
Oscillators and moving averages to forecast the trend of BTCUSD
CMP- $92061
EMA (4-hour chart)
55-EMA- $90893
200-EMA- $93974
365-EMA- $98608. The pair trades above the short and below the long-term moving average.
Major Support - $90000. Any breach below $90000 will drag the pair down to $86000/$83000/$80000.
Major Resistance - $95000. Any break above $95000 confirms minor bullishness, a jump to $95415/$97400/$98500/$10000.
Indicators (4-hour chart)
CCI(50)- Bullish
ADX- Neutral
Investment Strategy for BTCUSD
It is good to buy on dips around $90000 with a stop loss around $86000 for target profits of $100000/$107000.


