


 BTC’s Bear Bounce: Sell the Rally Near $66K as Bears Target $59K–$52K Breakdown
  Ethereum Cracks Under $1,700: Sell the Rally Near $1,750 as Bears Eye $1,380–$1,200
  FxWirePro- Major Crypto levels and bias summary


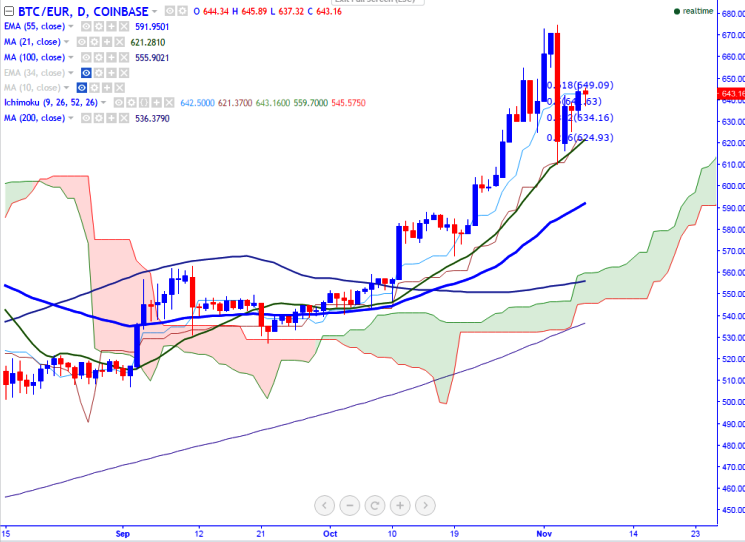
BTC/EUR is seen trading slightly above on Monday. The pair jumped sharply after making a temporary bottom around 610 on 3rd Nov 2016 (COINBASE). It is currently trading around 644.45 at the time of writing.
Ichimoku analysis of daily chart shows:
Tenkan-Sen level: 642.50
Kijun-Sen level: 621.37
Trend reversal level - (100 day MA) – 555
Long-term trend remains to be bullish. In the daily chart, BTC/EUR trades above Tenkan-Sen and Kijun-SEN and jump till 673 high made on Nov 1st is possible.
Major resistance is around 649.09 (61.8% retracement of 673.25 and 610) and any violation above will take the pair till 673 (161.8% retracement of 625 and 655) /683.11 (88.6% retracement of 715 and 434.58)/700. Short-term support is seen at 618 (21- day MA) and any break below targets 590 (55- day EMA)/555 (100- day MA).

- News

- Economy

- Central Banks
- Investing
- Research
- Roundups
- Digital Currency
- Insights
- Technical Analysis
- Technology
- Business
- Law
- Health
- Nature
- Fintech
- Science
- Topic
- Opinions
- ©Econometrics LLC . All Rights Reserved.
BTC/EUR holds above 600 level, jump till 673 likely
Monday, November 7, 2016 8:54 AM UTC
Editor's Picks


- Market Data
Most Popular


