


 FxWirePro: GBP/AUD loses momentum but outlook is bullish
  BTCUSD Bullish Breakout: Clears 800-EMA After Consolidation, Buy Dips Toward $74,900
  ETHUSD Bullish Momentum: Follows BTC Above All EMAs, Buy Dips Near $1750 Targeting $2300
  FxWirePro: USD/CAD falls after BoC rate hold and weak U.S. producer inflation
  AUDJPY Extremely Bullish Above 113: Strong AUD Fuels Fresh Rally – Buy Dips at 113 Targeting 115
  FxWirePro- Major Crypto levels and bias summary
  FxWirePro: EUR/AUD outlook weaker on renewed downside pressure
  GBPUSD, AUDUSD & NZDUSD Turn Extremely Bullish: Strong Positive Momentum Drives Major Pair Action Bias
  FxWirePro: EUR/AUD bears maintain upper hand


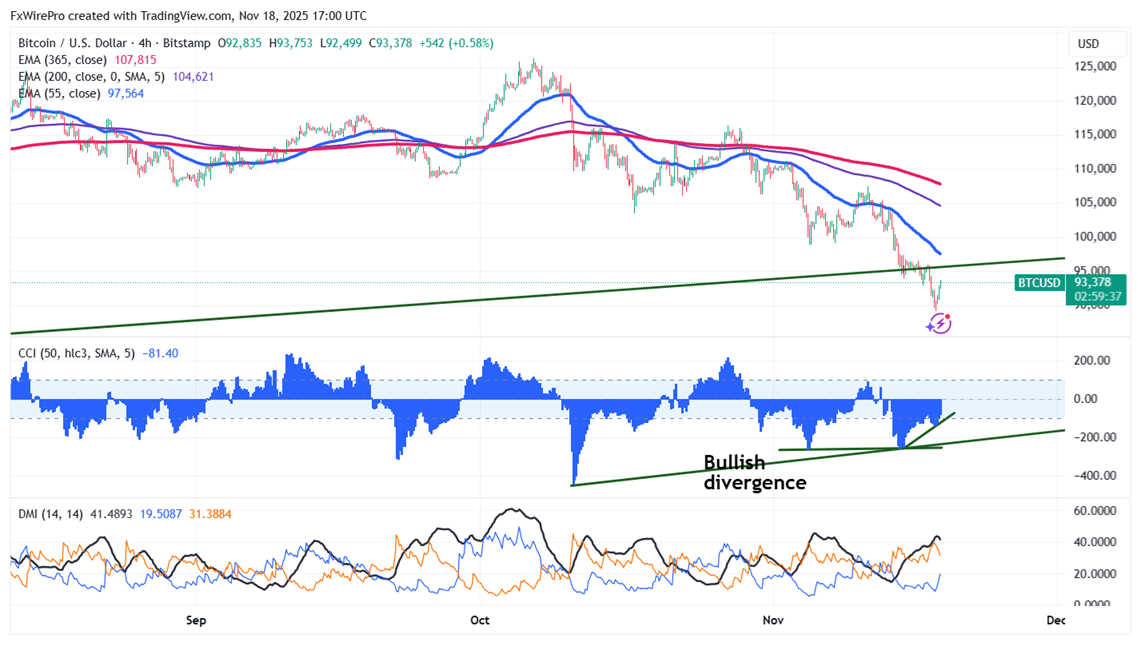
Chart pattern - Bullish divergence in CCI(50)- Both 4-hour and Daily charts.
The CCI line crosses back over the -100 level from the oversold area, confirming that the upward movement is actually taking shape.
Technical Analysis: Key Levels to Watch for BTC/USD
BTC/USD recovered after a minor decline below $90000. The pair hits an intraday high of $93753 and is currently trading around $93434.
It trades below short-term (34-EMA and 55-EMA) and long-term (200 and 365-EMA) moving averages on the 4-hour chart. Minor support is around $92800; breaking below this would drag the pair down to $89000/$86500/$80000. Immediate resistance is around $96000 indicates that closing above this level could lead to targets $10000/$105900/$108000/$115000/$120000/$126500.
Investment Strategy: Opportunities for Traders
Indicators (4-hour chart).
CCI(50)- Bearish
Directional movement index - Neutral
It is good to buy on dips around $92000 with a stop-loss set at $86500 for a TP of $115000/$120000.


