BTC/GBP upside capped by 10-DMA, further bullishness only above 611
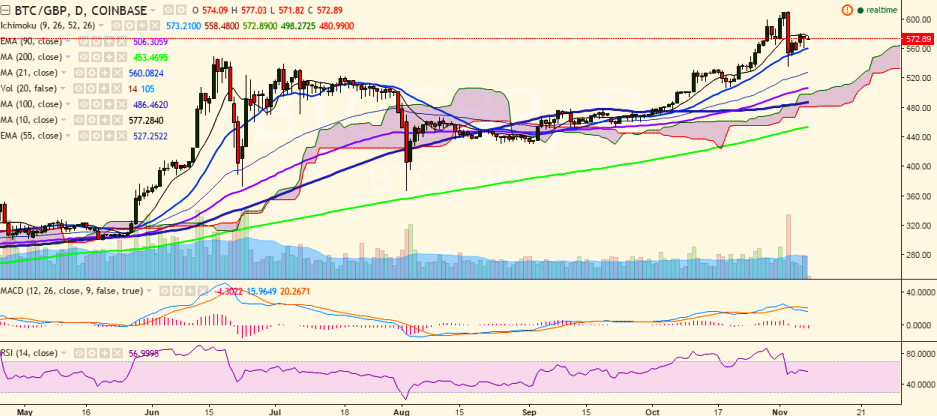
BTC/GBP upside is still being capped by 10-day MA and the pair has failed to break above this level. It is currently trading at 572.65 levels (Coinbase). Long-term trend: Bullish Short-term trend: Bullish Ichimoku analys…
BTC/GBP upside is still being capped by 10-day MA and the pair has failed to break above this level. It is currently trading at 572.65 levels (Coinbase).
Long-term trend: Bullish
Short-term trend: Bullish
Ichimoku analysis of daily chart:
Tenkan Sen: 573.21
Kijun Sen: 558.48
Trend reversal: 504.80 (90 EMA)
Major resistance is seen at 579 (10-day MA) and a break above would target 599.05 (127.2% retracement of 549.45 and 367.10). Further strength would see the pair testing 611.12 (November 03 high)/650.00.
On the reverse side, support is seen at 557.60 (21-day MA) and a break below would drag it to 535 (November 03 low)/525.56 (55 EMA).