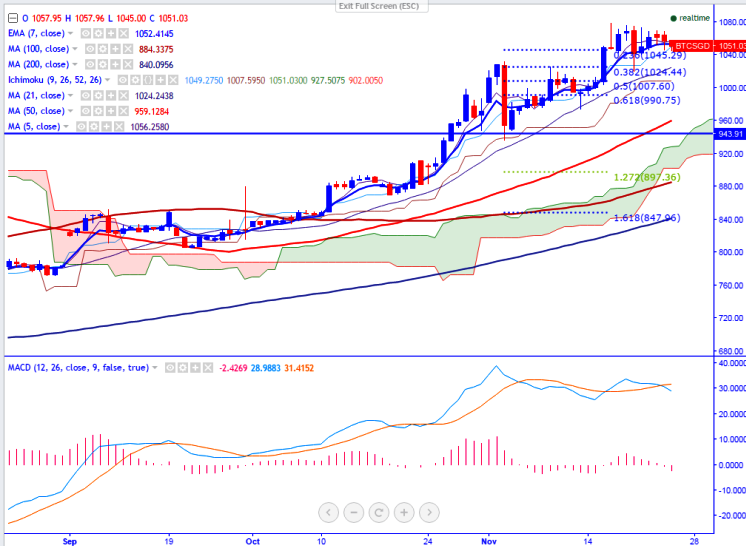
BTC/SGD faces strong support at 23.6% fibo, good to buy on dips
BTC/SGD is seen trading below in red on Friday. The pair has jumped till 1069 and started to decline from that level (ITBIT).It is currently trading around 1049.63 at the time of writing. Ichimoku analysis of daily chart…
BTC/SGD is seen trading below in red on Friday. The pair has jumped till 1069 and started to decline from that level (ITBIT).It is currently trading around 1049.63 at the time of writing.
Ichimoku analysis of daily chart shows:
Tenkan-Sen level: 1041
Kijun-Sen level: 1007
Trend reversal level - (100 day MA) – 881
Long-term trend remains to be bullish. BTC/SGD downside is capped by 23.6% retracement of 936.20 and 1078.90. Any break below will take the pair to next level till 1020/1007.
Major resistance is around 1080 (Nov 17th, 2016 high) and any break above that level will take the pair to next level till 1090 (161.8% retracement of 1031.92 and 936.20)/1160 (127.2% retracement of 1051.92 and 650)/1204 (138.2% retracement of 1051.92 and 650). Short-term support is seen at 1045 (23.6% retracement of 936.20 and 1078.99) and any break below targets 1020 (21- day MA)/1007 (daily Kijun-Sen).
The $0.131 mark was the late-September high; a revisit would depend on Bitcoin (BTC) strengthening and crypto-market sentiment improving. No timeframe was given.