


 FxWirePro: GBP/USD gains some ground but outlook still bearish
  Trump has made more than $1 billion from crypto in a year. How?
  AUDJPY Faces Headwinds: Selling on Rallies Advised as Bearish Trend Emerges
  FxWirePro: NZD/USD advances as weak U.S. payrolls pressure greenback
  Trump Reports $1.4 Billion in Crypto Income as Digital Assets Become Top Wealth Source
  FxWirePro: EUR/AUD bull’s hold the higher ground, remains on bullish path
  GBPJPY Weakens Amid Yen Strength: Sell on Rallies Recommended
  ETHUSD Forms Double Bottom at $1500, Signaling Potential Bullish Reversal


US. spot Bitcoin ETFs showed increased volatility this week, marked by a $408 million net inflow on July 2, 2025, led by Fidelity's ETF with a single-day inflow of $184 million. This fast recovery followed a hefty outflow of $342 million on July 1, which brought a 15-day run that gathered more than $4. 7 billion from mid-June. U.S.-listed spot Bitcoin ETFs have attracted $9. 91 billion in inflows since May 1, 2025, accounting for around 20% of their entire inflows since their debut in January 2024. The resurrected surge, especially fueled by the Fidelity ETF, portends a quick recovery of institutional interest following a brief dip.
US and Vietnam trade deal has increased demand for riskier assets like Bitocoin.
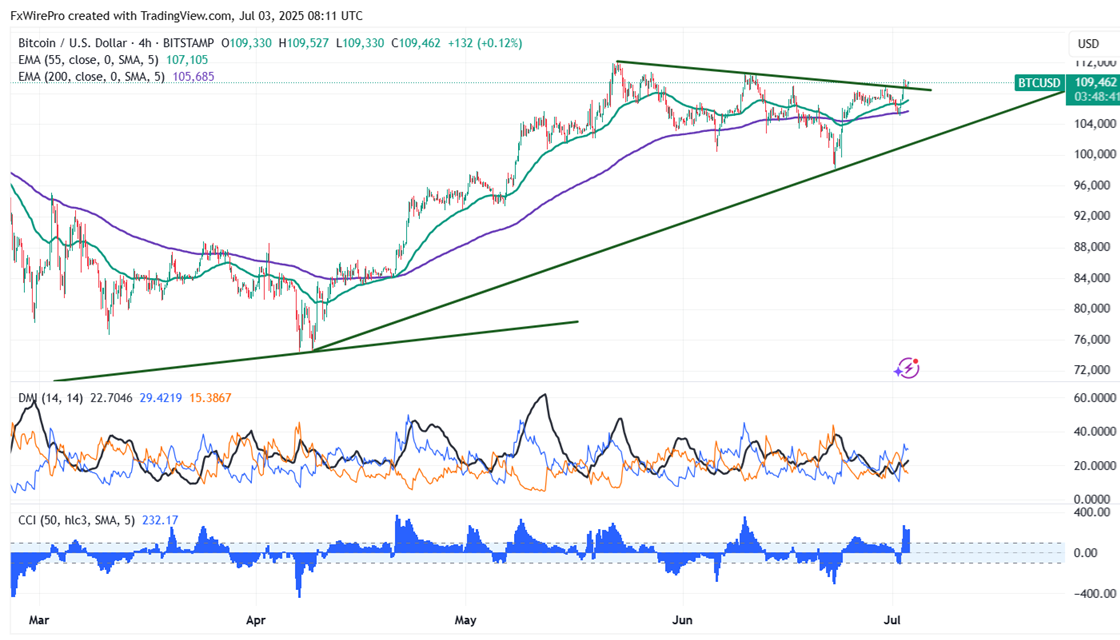
Technical Analysis: Key Levels to Watch for BTC/USD
BTC/USD breaks minor trend line resistance$108700 and holds above that level.It trades above both short-term (34-EMA and 55-EMA) and long-term (200-EMA) moving averages on the 4-hour chart. Minor support is around $103000; breaking below this would drag the pair down to $10000/$94660/$90000. Immediate resistance is around $110,000, indicating that closing above this level could lead to targets at $111,292, $115,000, or even $135,000.
Investment Strategy: Opportunities for Traders
Indicators (4-hour chart).
CCI(500- Bullish
Directional movement index - Bullish
It is good to buy on dips around $108000 with a stop-loss set at $105000 for a TP of $135000.


