Home / Digital Currency / Article Digital Currency
Add as a preferred source on Google BTC/USD Short Term outlook BTC/USD is facing resistance around $244 and short term bullishness can be seen only above that level. Any break above $244 will take the pair further up till $258. On the down side minor support is around $230 and any b…
Image from the original EconoTimes article Read the original article
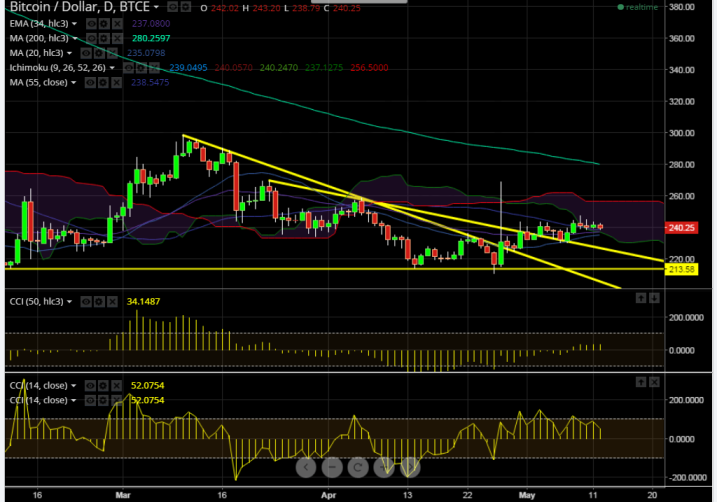
BTC/USD is facing resistance around $244 and short term bullishness can be seen only above that level.
Any break above $244 will take the pair further up till $258.
On the down side minor support is around $230 and any break below will take the pair further down till $224/$211.
Indicator (Daily chart)
CCI (50) -Buy
Woodies CCI (14) - Buy
Ichimoku- Buy
We prefer to go long in BTC/USD around $235 with stop around $224 for the target of $258.
Digital Currency Bitcoin (BTC)’s year-end odds of reaching $100,000 fell to 27%, while Ether (ETH)’s chance of hitting $3,500 slipped to 15%.
Digital Currency Ether (ETH)’s long-position share fell 2.02 percentage points to 58.65%, while Dogecoin (DOGE)’s declined 6.06 percentage points to 69.82%.
Digital Currency The transaction left about half of Jelitics’ previous SI holdings. Its cumulative loss was $562,000 after a $1.4 million investment.