


 FxWirePro- Major Crypto levels and bias summary
  FxWirePro- Major Crypto levels and bias summary
  BTC’s Bear Bounce: Sell the Rally Near $66K as Bears Target $59K–$52K Breakdown


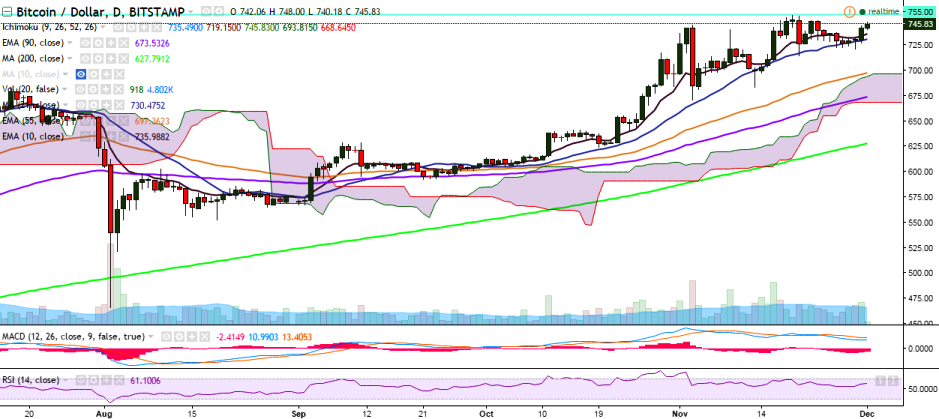
BTC/USD soared higher on Wednesday after trading flat for couple of days. The pair has broken above 10-EMA and is trading at 747 levels at the time of writing (Bitstamp).
Long-term trend: Bullish
Ichimoku analysis of daily chart:
Tenkan Sen: 735.50
Kijun Sen: 719.15
Trend reversal: 671.90 (90 EMA)
On the upside, the pair is now targeting 755 (November 19 high) and further bullishness would be seen only if it breaches this level. Further strength would see it testing 778.85 (June 18 high)/ 819.61 (113% retracement of 778.85 and 465.28).
On the down side, the pair has taken support near 728.98 levels (21-day MA) and any violation would drag it to 714 (November 20 low)/ 702 (61.8% retracement of 670.32 and 755.07).

- News

- Economy

- Central Banks
- Investing
- Research
- Roundups
- Digital Currency
- Insights
- Technical Analysis
- Technology
- Business
- Law
- Health
- Nature
- Fintech
- Science
- Topic
- Opinions
- ©Econometrics LLC . All Rights Reserved.
BTC/USD breaches 10-EMA resistance, break above 755 eyes 780
Thursday, December 1, 2016 8:42 AM UTC
Editor's Picks


- Market Data
Most Popular


