


 Ethereum Cracks Under $1,700: Sell the Rally Near $1,750 as Bears Eye $1,380–$1,200
  FxWirePro- Major Crypto levels and bias summary


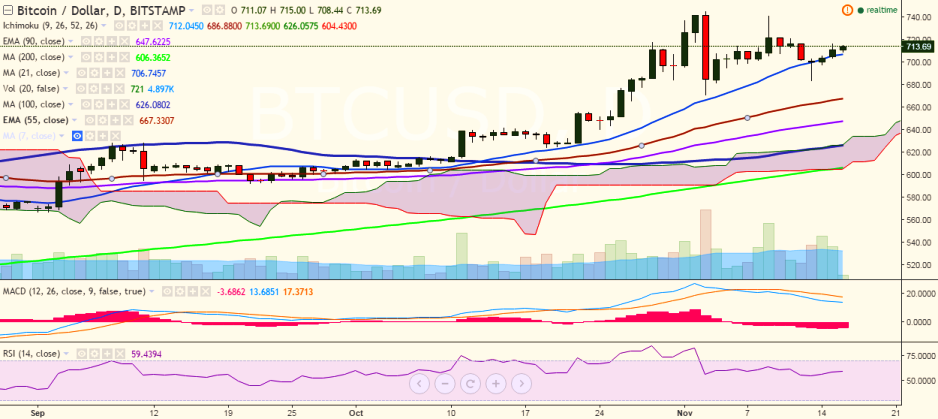
BTC/USD is gradually moving up after it fell to 683 levels. The pair is currently trading at 713 levels at press time (Bitstamp).
Long-term trend: Bullish
Short-term trend: Bullish
Ichimoku analysis of daily chart:
Tenkan Sen: 712.04
Kijun Sen: 686.34
Trend reversal: 646.13 (90 EMA)
On the up, the pair faces major resistance at 745 levels (November 03 high) and a break above would target 778.85 (June 18 high)/ 800 levels.
On the reverse side, the pair has taken support near 704.90 (21-day MA) and a break below would see a dip till 683(November 13 low)/ 665.61 (55 EMA).

- News

- Economy

- Central Banks
- Investing
- Research
- Roundups
- Digital Currency
- Insights
- Technical Analysis
- Technology
- Business
- Law
- Health
- Nature
- Fintech
- Science
- Topic
- Opinions
- ©Econometrics LLC . All Rights Reserved.
BTC/USD consolidates in narrow range, break above 745 targets 780
Wednesday, November 16, 2016 9:42 AM UTC
Editor's Picks


- Market Data
Most Popular


