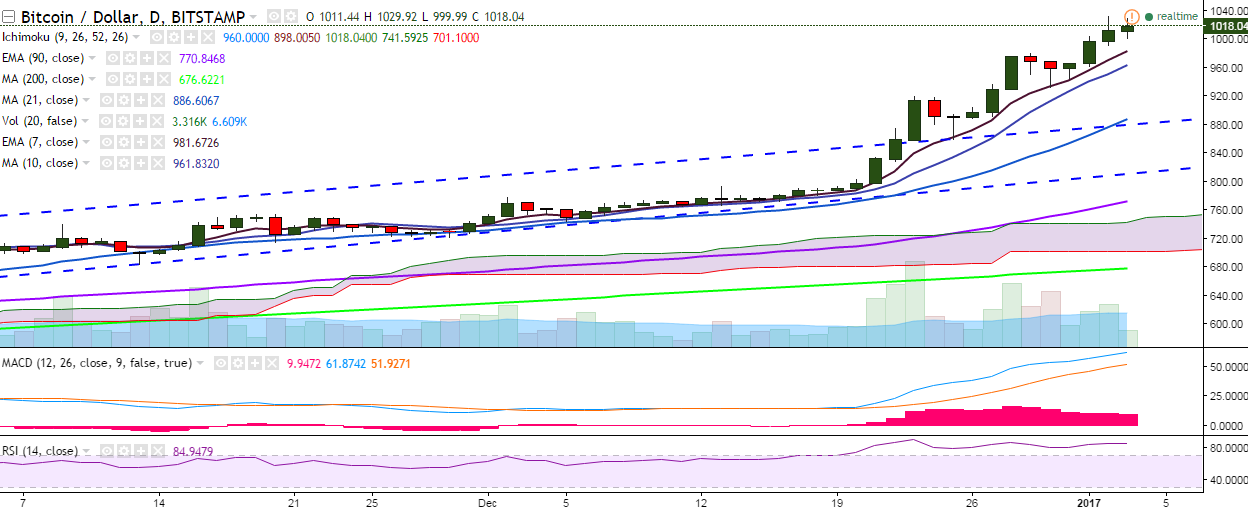
BTC/USD faces resistance at 1,032, break above targets 1,050
BTC/USD hit a three-year high of 1,032 levels on Monday and is currently trading slightly below this level at 1018 levels (Bitstamp). Long-term trend: Bullish Short-term trend: Bullish Ichimoku analysis of daily chart: T…
BTC/USD hit a three-year high of 1,032 levels on Monday and is currently trading slightly below this level at 1018 levels (Bitstamp).
Long-term trend: Bullish
Short-term trend: Bullish
Ichimoku analysis of daily chart:
Tenkan Sen: 945.50
Kijun Sen: 897.14
Trend reversal: 765.29 (90 EMA)
On the upside, the pair now faces resistance at 1032 levels (January 02 high) and a break above would target 1051 levels (241.4% retracement of 980.74 and 931)/ 1079 (127.2% extension of 859 and 1032).
Momentum studies remain bullish for the pair – the MACD line above the signal line and RSI(14) is at 85 – suggesting further upside.
On the reverse side, the pair is likely to take support at 969.55 (7-EMA) and a break below would see it testing 931 (December 30 low)/905 (61.8% retracement of 859 and 980.74).