


 BTC’s Bear Bounce: Sell the Rally Near $66K as Bears Target $59K–$52K Breakdown
  Ethereum Cracks Under $1,700: Sell the Rally Near $1,750 as Bears Eye $1,380–$1,200


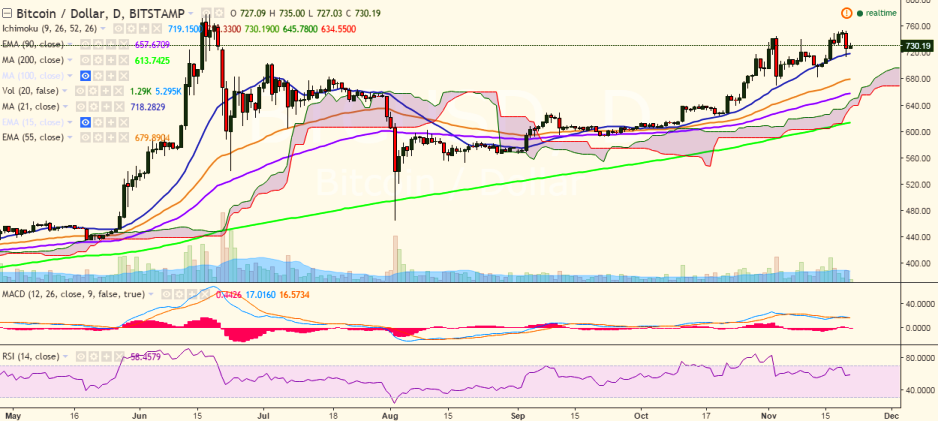
BTC/USD declined to 714 levels after it hit 755 levels on November 19. It is currently trading at 730 levels at the time of writing (Bitstamp).
Long-term trend: Bullish
Short-term trend: Bullish
Ichimoku analysis of daily chart:
Tenkan Sen: 719.15
Kijun Sen: 703.38
Trend reversal: 656.04 (90 EMA)
The pair must break above the previous high of 755 levels (November 19) for further upside. A consistent break above this level would see it testing 778.85 (June 18 high)/800 (psychological level).
On the reverse side, support is seen at 716.70 (21-day MA) and any violation would see a dip till 683 (November 13 low)/ 670 (November 03 low).

- News

- Economy

- Central Banks
- Investing
- Research
- Roundups
- Digital Currency
- Insights
- Technical Analysis
- Technology
- Business
- Law
- Health
- Nature
- Fintech
- Science
- Topic
- Opinions
- ©Econometrics LLC . All Rights Reserved.
BTC/USD faces resistance at 755, break above targets 778
Monday, November 21, 2016 10:16 AM UTC
Editor's Picks


- Market Data
Most Popular


