


 FxWirePro- Major Crypto levels and bias summary
  Ethereum Cracks Under $1,700: Sell the Rally Near $1,750 as Bears Eye $1,380–$1,200
  FxWirePro- Major Crypto levels and bias summary


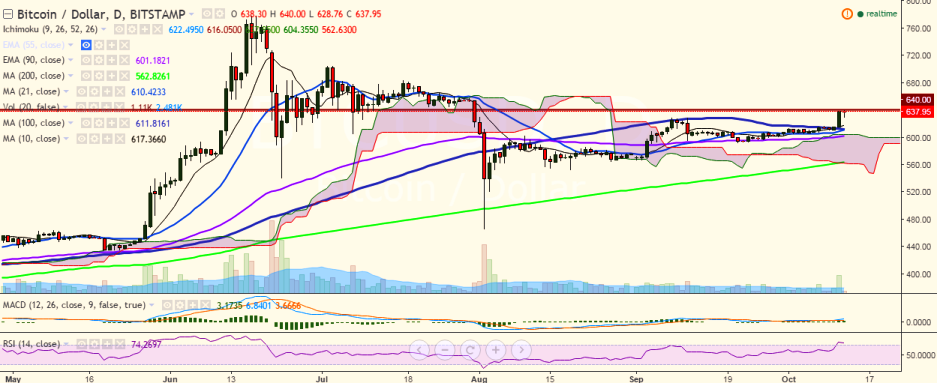
BTC/USD is fell to 628.76 levels before restoring to 637 levels, where it currently trades. It has hit a high of 640 levels so far in the day (Bitstamp).
Long-term trend: Bullish
Short-term trend: Bullish
Ichimoku analysis of daily chart:
Tenkan Sen: 621.99
Kijun Sen: 615.55
Trend reversal: 600.35 (90 EMA)
Immediate resistance is seen at 640 (today’s high) and a break above would see the pair testing 651.79 (161.8% retracement of 628.99 and 592.10)/ 704.99 (July 03 high).
On the downside, support is likely to be found at 614.43 (10-day MA) and a break below would target 600.35 (90 EMA)/552.30 (August 19 low).

- News

- Economy

- Central Banks
- Investing
- Research
- Roundups
- Digital Currency
- Insights
- Technical Analysis
- Technology
- Business
- Law
- Health
- Nature
- Fintech
- Science
- Topic
- Opinions
- ©Econometrics LLC . All Rights Reserved.
BTC/USD hits fresh high of 640, jump till 705 likely
Wednesday, October 12, 2016 8:45 AM UTC
Editor's Picks


- Market Data
Most Popular


