


 FxWirePro- Major Crypto levels and bias summary
  FxWirePro- Major Crypto levels and bias summary
  FxWirePro- Major Crypto levels and bias summary
  FxWirePro- Major Crypto levels and bias summary


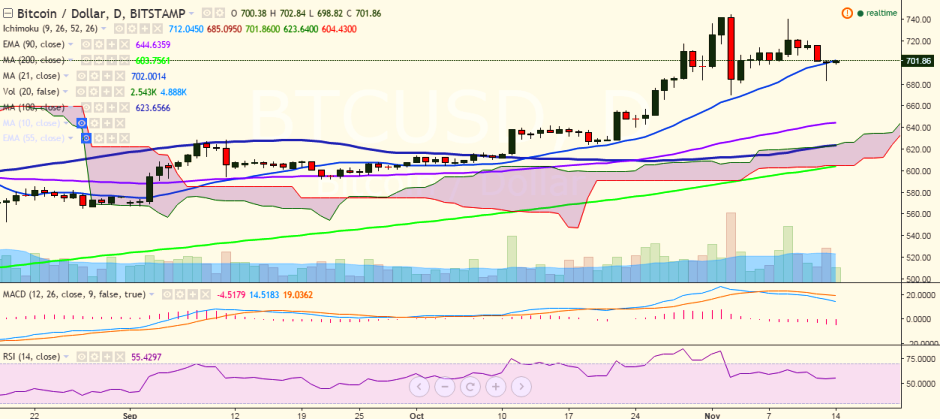
The surge seen recently in BTC/USD as Donald Trump was elected as the 45th POTUS evaporated gradually. The pair fell below the 700 mark on November 13 and is currently trading at 701 levels (Bitstamp).
Long-term trend: Bullish
Short-term trend: Bullish
Ichimoku analysis of daily chart:
Tenkan Sen: 712.04
Kijun Sen: 684.66
Trend reversal: 643.39 (90 EMA)
“The pair has broken below 21-day MA and is now trying to hold its strength above the 700 mark. It must close above this level for further upside”, FxWirePro said in a statement.
On the upside, a close above the 700 mark would see the pair testing 718.85 (61.8% retracement of 740.86 and 683.23)/ 745 levels (November 03 high).
On the reverse side, support is seen at 683.23 (yesterday’s low) and any violation would drag it to 670 (November 03 low)/ 643.39 (90 EMA).

- News

- Economy

- Central Banks
- Investing
- Research
- Roundups
- Digital Currency
- Insights
- Technical Analysis
- Technology
- Business
- Law
- Health
- Nature
- Fintech
- Science
- Topic
- Opinions
- ©Econometrics LLC . All Rights Reserved.
BTC/USD slips below 21-DMA, close above targets 745
Monday, November 14, 2016 7:23 AM UTC
Editor's Picks


- Market Data
Most Popular


