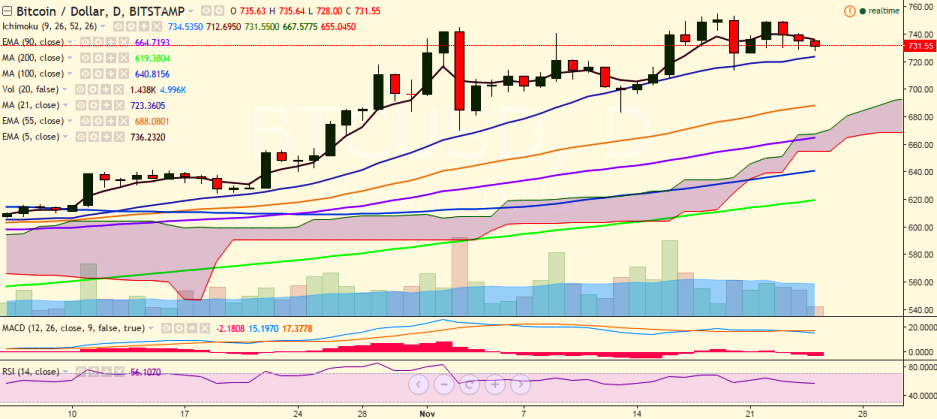
BTC/USD takes support near 21-DMA, break below confirms minor bearishness
BTC/USD is showing a dip after it ran into resistance at 750 levels. It has slipped below 5-EMA and is trading at 731 levels at the time of writing (Bitstamp). Long-term trend: Bullish Short-term trend: Bullish Ichimoku …
BTC/USD is showing a dip after it ran into resistance at 750 levels. It has slipped below 5-EMA and is trading at 731 levels at the time of writing (Bitstamp).
Long-term trend: Bullish
Short-term trend: Bullish
Ichimoku analysis of daily chart:
Tenkan Sen: 731.75
Kijun Sen: 712.69
Trend reversal: 663.21 (90 EMA)
Immediate resistance is seen at 738 (5-EMA) and a break above would see the pair testing 755 levels (November 19 high). Further strength would target 778.85 (June 18 high)/800 (psychological level).
On the reverse side, support is seen at 721.98 (21-day MA) and a break below would confirm minor bearishness in the pair, dragging it to 714 (November 20 low)/ 702 (61.8% retracement of 670.32 and 755.07).
The $0.131 mark was the late-September high; a revisit would depend on Bitcoin (BTC) strengthening and crypto-market sentiment improving. No timeframe was given.