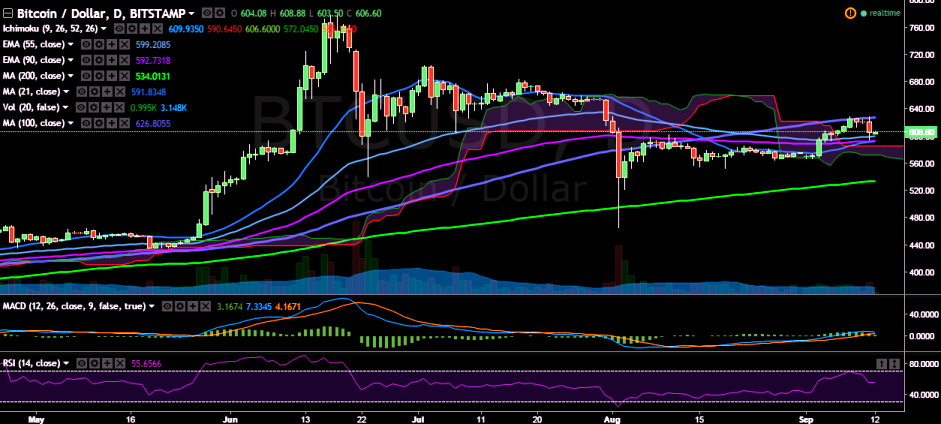
BTC/USD takes support near 90-EMA, break below confirms bearishness
BTC/USD has declined sharply after hovering around 100-day MA for few days. It is currently trading at 606.44 levels (Bitstamp). Long-term trend: Bullish Short-term trend: Bearish Ichimoku analysis of daily chart: Tenkan…
BTC/USD has declined sharply after hovering around 100-day MA for few days. It is currently trading at 606.44 levels (Bitstamp).
Long-term trend: Bullish
Short-term trend: Bearish
Ichimoku analysis of daily chart:
Tenkan Sen: 599
Kijun Sen: 590.64
Trend reversal: 592.42 (90 EMA)
“The pair has taken support near 90-day EMA and is currently holding its strength above 600 mark. Only a consistent break above 100-day MA would see further upside in BTC/USD” FxWirePro said in a statement.
On the topside, major resistance is seen at 626.47 (100-day) and a break above would target 653.69 (78.6% retracement of 704.99 and 465.28)/ 705 (July 3 high).
On the other hand, support is seen at 592.42 (90 EMA), and a break below would drag the pair to 547.14 (50% retracement of 465.28 and 628.99)/ 533 (200-day MA).
A separate 16-month sample ending in September 2026 found more than 87% of payments between $0.0001 and $0.10, but its window extends beyond the transaction tally’s cutoff.