


 Bitcoin Cracks $75K as $1.3B ETF Exodus and Middle East Jitters Spook Bulls; Bears Eye $70K
  Ethereum Tumbles Below $2K: Bears Eye $1,700 as All Key EMAs Flip Red


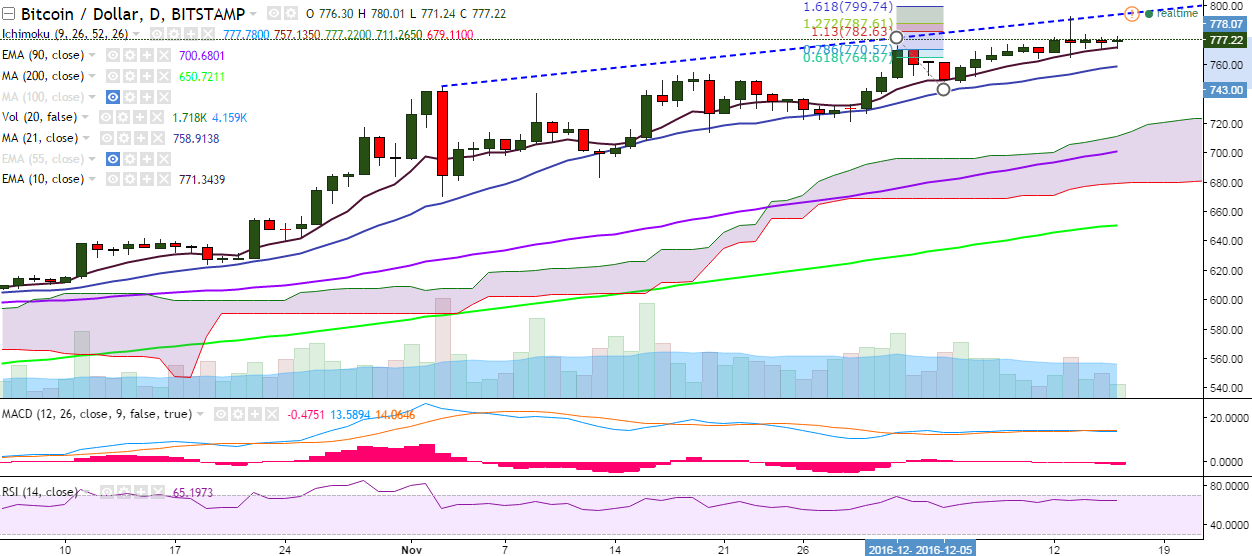
BTC/USD continues trading flat on Friday and is currently hovering around 778 levels at the time of writing (Bitstamp).
Long-term trend: Bullish
Short-term trend: Bullish
Ichimoku analysis of daily chart:
Tenkan Sen: 772.52
Kijun Sen: 753.63
Trend reversal: 698.96 (90 EMA)
On the upside, the pair is facing strong resistance at 782.63 levels (113% retracement of 778.07 and 743) and a break above would target 793.27 (December 13 high). Further strength would see the pair testing 799.74 levels (161.8% retracement of778.07 and 743) /819 (113% retracement of 778.85 and 465.28).
On the flip side, the pair has taken support near 770 (10-EMA) and a break below would drag it to 757 (21-day MA)/743 (December 05 low)/714 (November 20 low).

- News

- Economy

- Central Banks
- Investing
- Research
- Roundups
- Digital Currency
- Insights
- Technical Analysis
- Technology
- Business
- Law
- Health
- Nature
- Fintech
- Science
- Topic
- Opinions
- ©Econometrics LLC . All Rights Reserved.
BTC/USD trades rangebound, further bullishness only above 793
Friday, December 16, 2016 10:14 AM UTC
Editor's Picks


- Market Data
Most Popular


