


 Ethereum Cracks Under $1,700: Sell the Rally Near $1,750 as Bears Eye $1,380–$1,200
  FxWirePro- Major Crypto levels and bias summary
  BTC’s Bear Bounce: Sell the Rally Near $66K as Bears Target $59K–$52K Breakdown
  FxWirePro- Major Crypto levels and bias summary
  FxWirePro- Major Crypto levels and bias summary


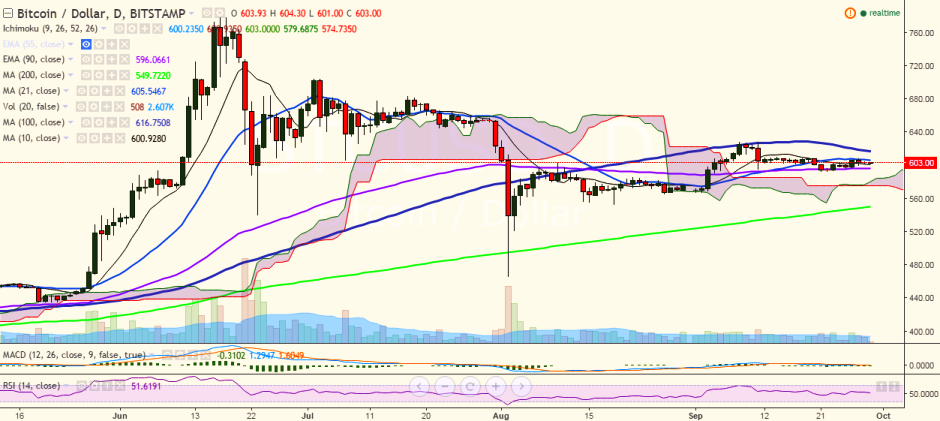
BTC/USD is trading flat and trying to hold its strength above 600 levels. It is currently trading at 603 levels (Bitstamp).
Long-term trend: Bullish
Short-term trend: Bearish
Ichimoku analysis of daily chart:
Tenkan Sen: 600.49
Kijun Sen: 599
Trend reversal: 595.91 (90 EMA)
“The pair’s upside is being capped by 21-DMA,while it has taken support near 10-DMA on the downside. The short-term trend appears weak and a break below 600 would target 592 levels (September 21 low)”, FxWirePro said in a statement.
Major resistance is seen at 606.62 (21-day MA) and a break above would see the pair testing 617.39 (100-DMA)/ 628 (September 11 high).
On the flipside, the pair is likely to find support near 600 levels and a break below would target 595.91 (90 EMA)/548.77 (200-day MA).

- News

- Economy

- Central Banks
- Investing
- Research
- Roundups
- Digital Currency
- Insights
- Technical Analysis
- Technology
- Business
- Law
- Health
- Nature
- Fintech
- Science
- Topic
- Opinions
- ©Econometrics LLC . All Rights Reserved.
BTC/USD trades weaker, break below 600 targets 592
Thursday, September 29, 2016 7:13 AM UTC
Editor's Picks


- Market Data
Most Popular


