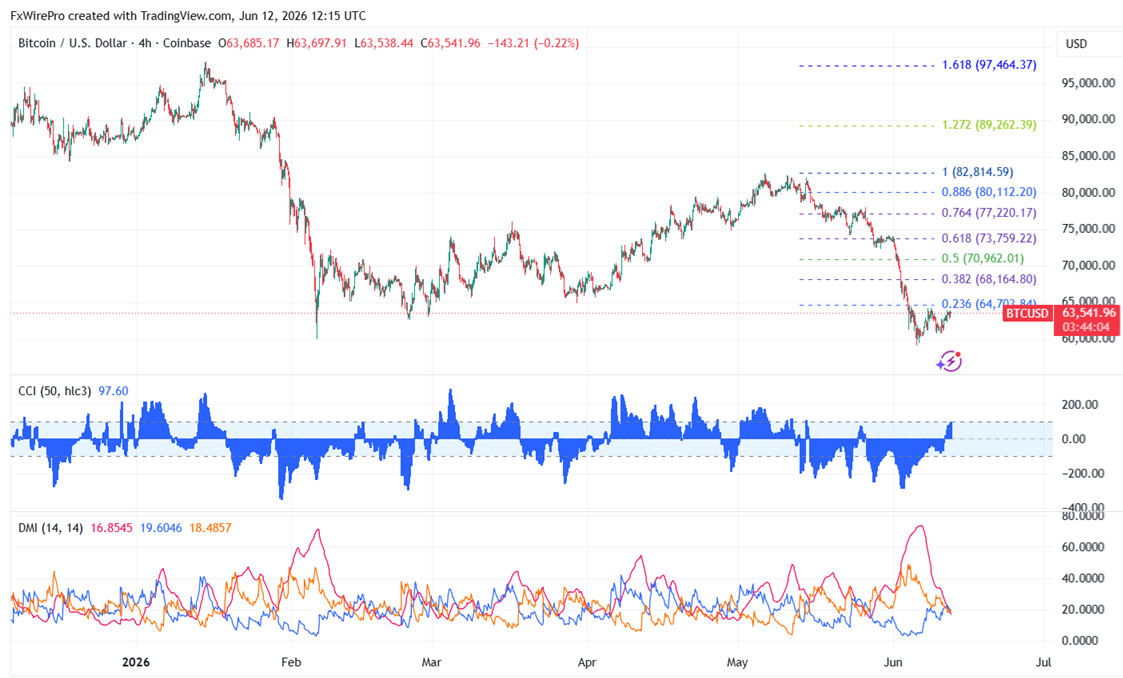
BTCUSD showed a minor pullback on easing geopolitical tension. It has dropped to $59904 and is now trading at about $63566.
|
Technicals |
CMP -$63561 |
Trend |
|
|
4- Hour chart |
Value |
|
|
|
55 EMA |
$63912 |
CMP<55 EMA |
Bearish |
|
200- EMA |
$70071 |
CMP <200- EMA |
Bearish |
|
365- EMA |
$72201 |
CMP<365 EMA |
Bearish |
Major support- $59000/$52796. Minor bullishness only above $65000. Any break above targets $66500/$68000/$70000/$72200/$74950/$78000/$80000.
|
Momentum indicator (4-hour chart) |
Inference |
Value |
|
CCI(50) |
Bearish |
91.63 |
|
ADX |
Neutral |
|
It is good to sell on rallies around $66000, with an SL around $70000, for a TP of $59500/$52750.


EUR/JPY Poised to Slide — Sell Rallies into 185.30 with Eye on 183"
FxWirePro: GBP/USD advance after softer US inflation dims Fed rate hike bets
AUDJPY Extremely Bullish Above 113: Strong AUD Fuels Fresh Rally – Buy Dips at 113 Targeting 115
FxWirePro- Major Crypto levels and bias summary
GBPUSD, AUDUSD & NZDUSD Turn Extremely Bullish: Strong Positive Momentum Drives Major Pair Action Bias
FxWirePro: NZD/USD advances as hawkish outlook by a top policy maker boosts kiwi dollar
FxWirePro- Major Pair levels and bias summary
BTCUSD Bullish Breakout: Clears 800-EMA After Consolidation, Buy Dips Toward $74,900
FxWirePro:EUR/NZD extends fall, key support lies ahead
FxWirePro- Major Crypto levels and bias summary 


