Rising Staked Bitcoin Volume Signals Investor Confidence
Bitcoin staking volumes soar due to improving investor confidence.
Staked volume increases further, which suggests that even more holders are willing to lock in their assets for earning rewards. Indicative of such a trend is that investors do not see Bitcoin solely as a store of value but as a source of income as well. As more Bitcoin is staked, this could result in less selling pressure in the markets. Although Bitcoin has a Proof-of-Work model by default, some platforms allow staking-like rewards, and this is on the increase. This general increase in staking could help stabilize the Bitcoin price and influence market dynamics
Significant ETF Outflows Amid Cautious Investor Sentiment
Weighty ETF Outflows During Cautious Investor Sentiment
Last week, Bitcoin exchange-traded funds (ETFs) witnessed significant outflows of around $388 million, which means investors are being cautious since the price of Bitcoin is hovering at around $96,000, down 11% from its recent peak of $108,268 in December 2024. Institutional interest in Bitcoin remains high despite the outflows. For example, MicroStrategy purchased more than 5,262 bitcoins for about $561 million during this period. This suggests that while some investors are pulling back their participation, others—especially institutional investors—are continuing to buy. Overall, the market is giving mixed signals about what will happen to Bitcoin.
Technical Analysis: Key Levels to Watch for BTC/USD
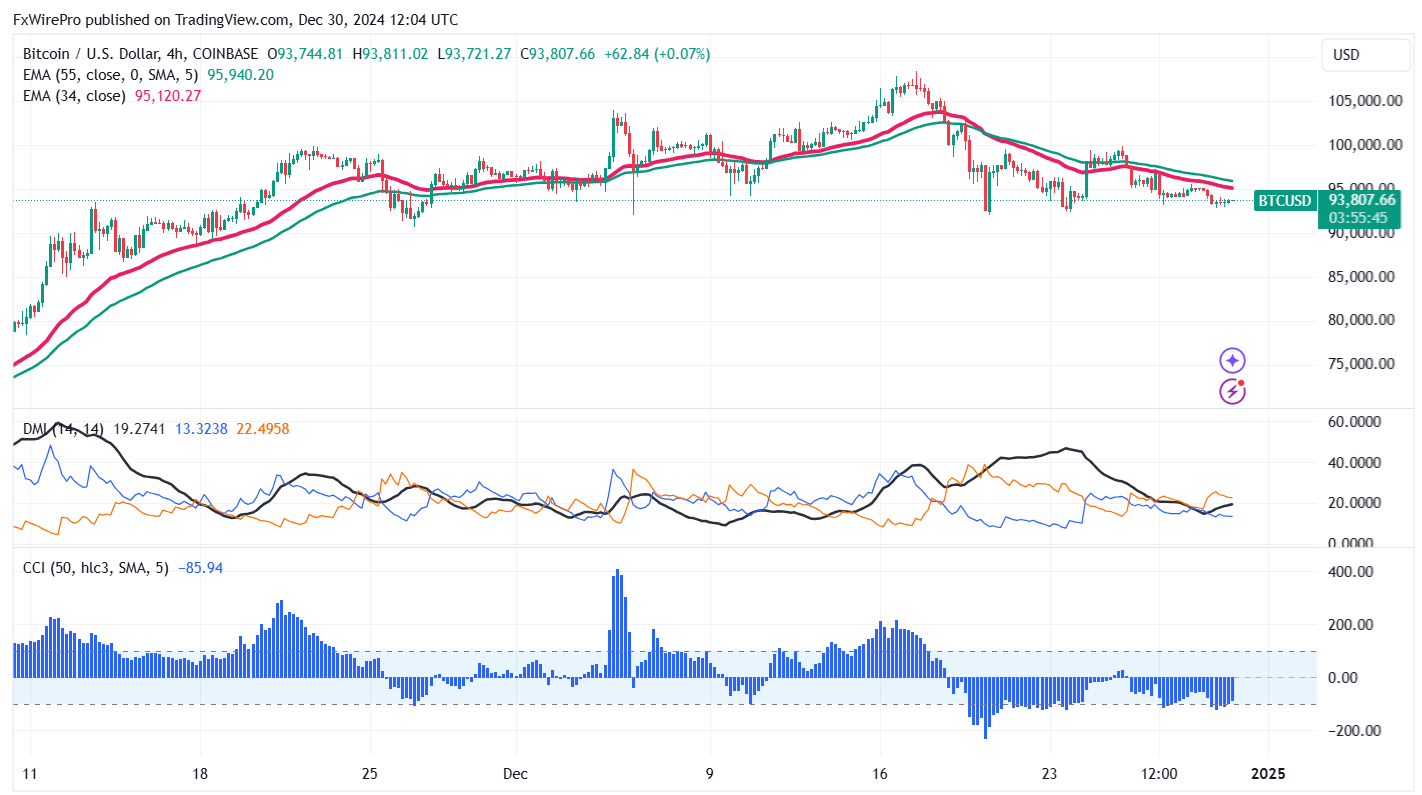
BTC/USD currently trades above both short-term (34-EMA and 55-EMA) and long-term (200-EMA) moving averages on the daily chart. Minor support is observed at $90,000; breaking below this could lead to targets at $86,700, $84,000, $80,000, or $75,800. Conversely, breaking through the primary supply zone at $100,000 would confirm intraday bullishness with the potential to reach $110,000. A secondary barrier at $110,000 indicates that closing above this level could lead to targets at $111,292, $115,000, or even $135,000.
Investment Strategy: Opportunities for Traders
Indicators on the 4-hour chart, like a bullish Commodity Channel Index (CCI) and Average Directional Movement Index, support this positive outlook. An investment strategy might involve buying on dips around $90,000, with a stop-loss set at $80,000, and targeting prices of $115,000 or $135,000.


 FxWirePro- Major Crypto levels and bias summary


