


 Morgan Stanley Names Marks & Spencer Top European Retail Pick, Sees Strong Upside
  ETHUSD Bullish Momentum: Follows BTC Above All EMAs, Buy Dips Near $1750 Targeting $2300
  BTCUSD Bullish Breakout: Clears 800-EMA After Consolidation, Buy Dips Toward $74,900
  FxWirePro- Major Crypto levels and bias summary
  Bank of America Upgrades T-Mobile to Buy, Says LEO Satellite Fears Are Overdone


Bitcoin ETFs and Whale Activity Shape Market Dynamics: Key BTC/USD Levels and Trading Strategies
Last week, Bitcoin ETFs saw considerable flow swings from a $40.4 million net outflow on October 20, driven by BlackRock's IBIT, with a Driven mostly by IBIT ($210.9M) and ARK's ARKB ($162.9M), $100.7 million redemption resulting in a stunning $477.2 million net inflow on October 21. Together, they made up for 78.3% of the day's inflows. Breaking a two-week streak of inflows, this reversal came after major outflows of $536 million previously during the week (October 16–17).
With a remarkable whale sending 5,252 BTC (about $588 million) to exchanges and establishing a $234 million short position, indicating probable selling pressure, whale action further magnified market dynamics. Data from CryptoQuant revealed more whale inflows to exchanges, 2,184 BTC moved—the most since early October—and revived inactive wallets, including one containing 445 BTC dormant for almost 13 years. Although some whales assumed bearish stances, others exhibited resilience, and one decreased unrealized losses from $10 million to $3.1 million, therefore indicating diverse tactics among big whales. holders among fluctuating ETF flows and price changes.
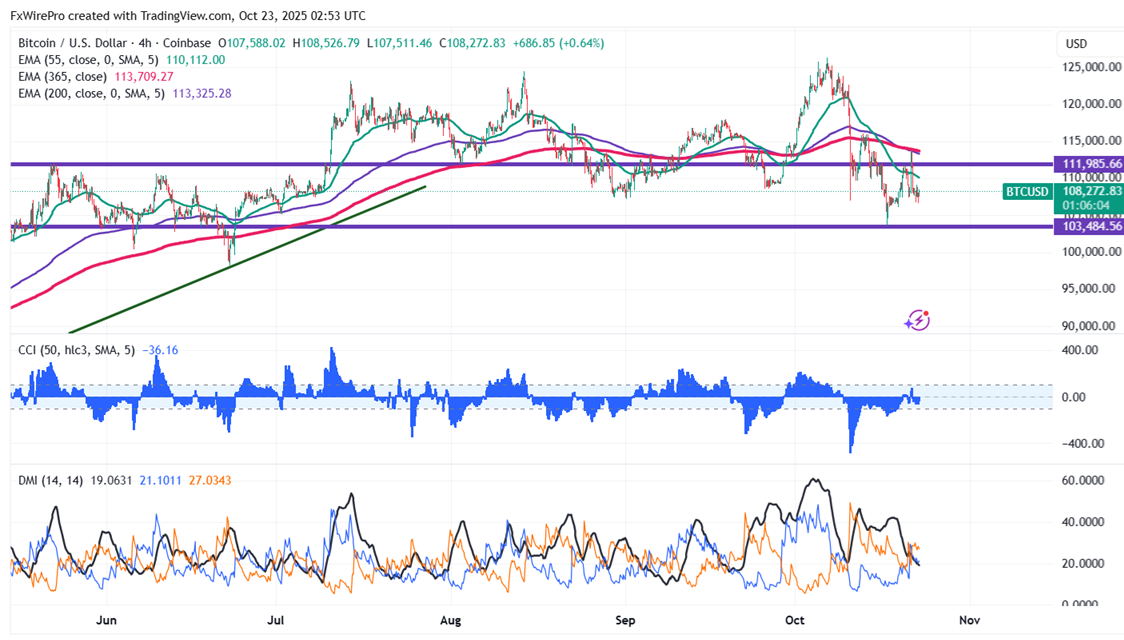
Technical Analysis: Key Levels to Watch for BTC/USD
BTC/USD pared some of its gains as the BTC ETF faces heavy redemption. The pair hit a high of $114082 and is currently trading around $108258.
It trades below short-term (34-EMA and 55-EMA) and long-term (200 and 365-EMA) moving averages on the 4-hour chart. Minor support is around $106000; breaking below this would drag the pair down to $103000/$10000/$98450/$94800. Immediate resistance is around $112275 indicates that closing above this level could lead to targets $114965, $116077, or even $120000/$126500.
Investment Strategy: Opportunities for Traders
Indicators (4-hour chart).
CCI(50)- Bullish
Directional movement index - Bullish
It is good to buy on dips around $100000 with a stop-loss set at $94850 for a TP of $114600/$118000.


