


 US Inflation Expected to Ease in June, but Fed Rate Hike Risks Persist Amid Middle East Tensions
  Morgan Stanley Names Marks & Spencer Top European Retail Pick, Sees Strong Upside
  Gold Pulls Back After Hitting $4,180 as Geopolitical Risk Sends Crude Higher
  UBS Boosts China Tech Bets, Adds Kuaishou and Meituan to Focus List
  Morgan Stanley Says China’s Reusable Rocket Progress Poses Long-Term Challenge to SpaceX
  JPMorgan Cuts Gold Price Forecast, Sees Bullion Reaching $4,500 by End of 2026
  ETHUSD Bullish Momentum: Follows BTC Above All EMAs, Buy Dips Near $1750 Targeting $2300
  FxWirePro- Major Crypto levels and bias summary


Bitcoin's April Turmoil: Navigating Tariffs, ETF Outflows, and Whale Activity
Trump's Trade Tactics and Their Ripple Effect on Crypto
In April 9 th 2025, President Trump reversed course and announced 90-day tariff relief for most countries due to concerns over market volatility, which followed a period of global market turmoil; however, China was excluded from this relief, and instead faced increased tariffs of 125% in response to their retaliatory tariffs on U.S. goods, leading to condemnation from China and a surge in the U.S. stock market, as Trump's decision was influenced by market reactions and internal pressures, underscoring the administration's continued hard line stance on trade with China.
Bitcoin ETFs Face Headwinds Amid Market Uncertainty
During the initial week of April 2025, the Bitcoin ETFs witnessed large outflows, including the highest outflow of $326.27 million on 9th April and the net outflow of $172.89 million for the week, snapping a two-week inflow run. The outflows were dominated by BlackRock's IBIT ETF. They are triggered due to increased market volatility and risk aversion induced by worldwide economic uncertainties and the ongoing trade war, especially President Trump's fresh tariffs. Bitcoin ETFs have recorded more than $5.5 billion in withdrawals within the last five weeks
Whale Activity Suggests Strategic Bitcoin Accumulation
Early April 2025 saw Bitcoin record an upsurge in whale activity as transactions of over $1 million reached a high of 1,715 on April 8, amidst a price recovery from levels of approximately $74,000 to over $81,000. The surge indicates increasing interest and likely accumulation by well-heeled investors. The 365 inactive BTC (not touched in over a decade) that moved, however, had a bearish impact. Despite the price volatility, total whale accumulation has been aggressive with real capitalization increasing substantially from 2023 onwards
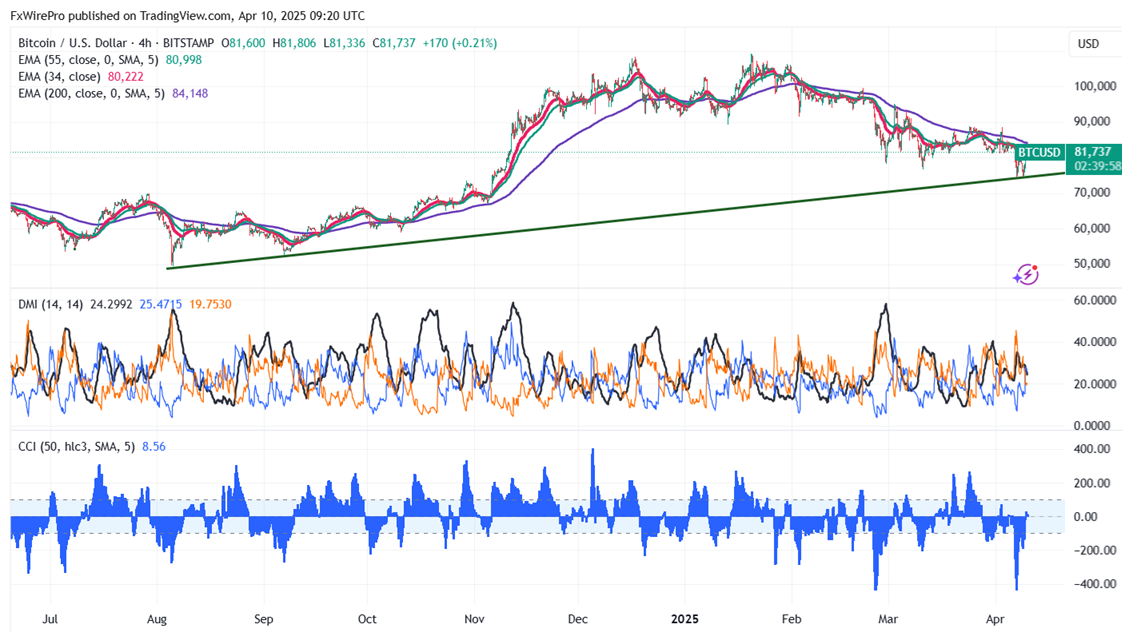
Technical Analysis: Key Levels to Watch for BTC/USD
BTC/USD currently trades above both short-term (34-EMA and 55-EMA) and below long-term (200-EMA) moving averages on the daily chart. Minor support is around $75800; breaking below this would drag the pair down to $72000/$65000. Immediate resistance is around $84500 any breach above confirms intraday bullishness, a jump to $90000/ $95000/$100000. A secondary barrier at $110,000 indicates that closing above this level could lead to targets at $111,292, $115,000, or even $135,000.
Investment Strategy: Opportunities for Traders
Indicators (4-hour chart).
CCI(500- Bullish
Directional movement index - Neutral
It is good to buy on dips around $80000, with a stop-loss set at $72000 for a TP of $110000.


