


 Jamie Dimon Warns Anthropic's Mythos AI Poses National Security Risks
  UBS Boosts China Tech Bets, Adds Kuaishou and Meituan to Focus List
  ETHUSD Bullish Momentum: Follows BTC Above All EMAs, Buy Dips Near $1750 Targeting $2300
  Morgan Stanley Says China’s Reusable Rocket Progress Poses Long-Term Challenge to SpaceX
  FxWirePro- Major Crypto levels and bias summary
  JPMorgan Cuts Gold Price Forecast, Sees Bullion Reaching $4,500 by End of 2026
  Goldman AM Sees Strong Buyout Opportunities in Japan, South Korea and Australia


Long-Term Holding on the Rise
CryptoQuant's Realized Cap UTXO Age Bands metric shows a sharp rise in Bitcoin (BTC) balances that have not been touched for three to six months, indicating a rising trend of long-term holding. The metric categorizes Bitcoin distributions by holding periods and determines that the older UTXO age bands are progressively dominant. This is a sign of more investors holding Bitcoin rather than selling, a sign of good market sentiment. This movement can have a significant influence on subsequent price action and market behavior, highlighting the significance of long-term holding in establishing market conditions.
Whale's Short Position
A Bitcoin whale has made an interesting market move by putting in a large short position, first at $332 million and subsequently raised to $464 million with 40x leverage. The liquidation price of the position is at $85,842. The whale later cut back the position by covering 500 BTC, but then shorted again to keep Bitcoin's price at below $83,700, sparking rumors of the whale's intentions and anticipation of future price action
Bitcoin ETF Outflows
Between March 2025 and the end of the fifth week, U.S. Bitcoin ETFs saw major net outflows valued at over $5 billion, with the first 17 days seeing $1.6 billion. BlackRock's IBIT, Fidelity's FBTC, and Grayscale's GBTC harbored the largest individual outflows. Despite a brief $274.59 million inflow on March 17, driven by Fidelity's ETF, the overall trend is attributed to profit-taking, macroeconomic uncertainties, and a shift to safer assets amidst geopolitical tensions, suggesting a potentially prolonged bearish sentiment
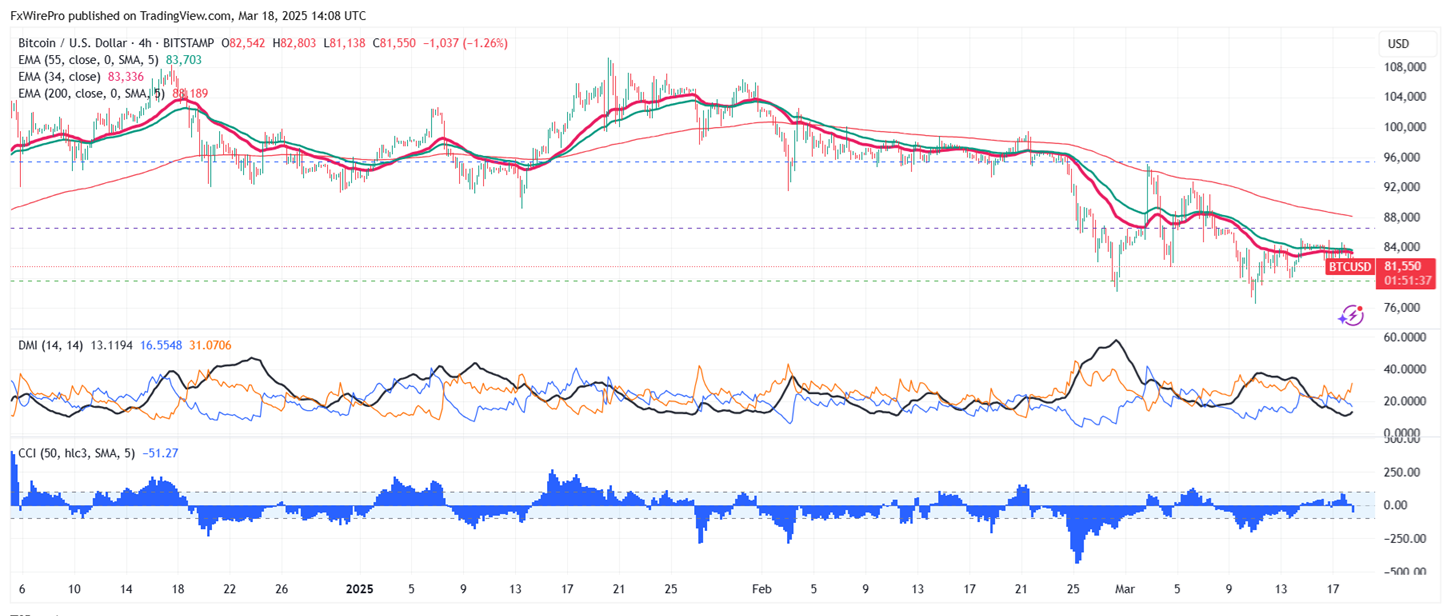
Technical Analysis: Key Levels to Watch for BTC/USD
BTC/USD currently trades above both short-term (34-EMA and 55-EMA) and long-term (200-EMA) moving averages on the daily chart. Minor support is around $75800; breaking below this would drag the pair down to $72000/$65000. Immediate resistance is around $86000 any breach above confirms intraday bullishness, a jump to $90000/$95000/$100000. A secondary barrier at $110,000 indicates that closing above this level could lead to targets at $111,292, $115,000, or even $135,000.
Investment Strategy: Opportunities for Traders
Indicators (4-hour chart).
It is good to sell on rallies around $90,000, with a stop-loss set at $100000 for a TP of $70000.


