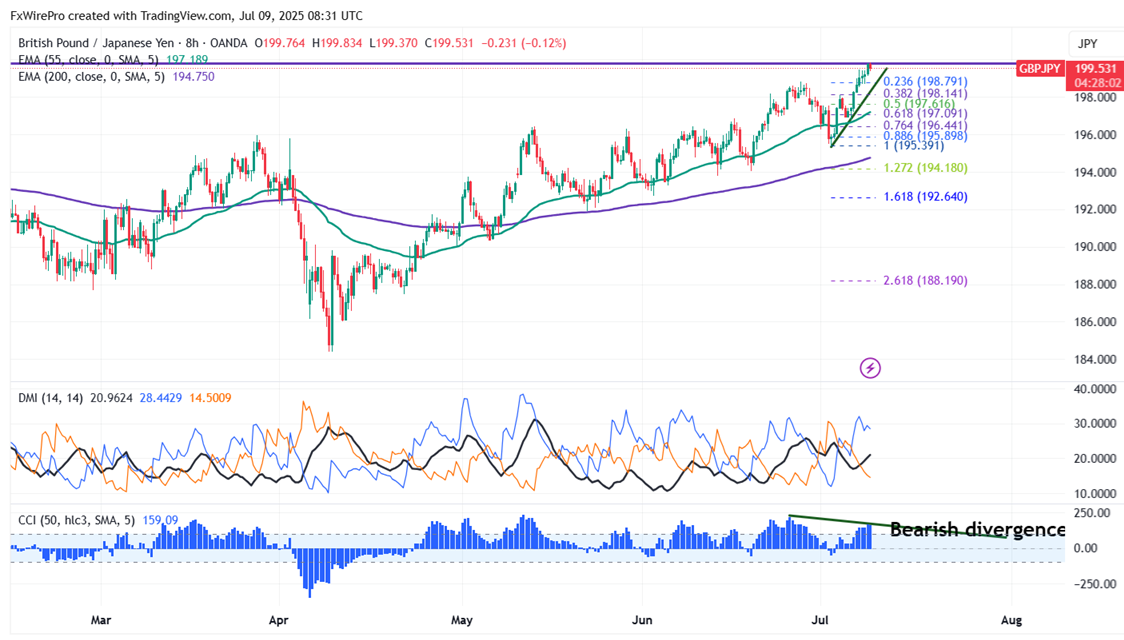
Chart pattern- Bearish Divergence (CCI(50) 8-hour chart)
The GBP/JPY hits a fresh multi-year high on board-based Yen weakness. It hit an intraday high of 199.83 and is currently trading around 1999.54. Intraday trend is bearish as long as the resistance at 200 holds.
The GBP/JPY pair is trading above 55 and 200 EMA (Short-term) and 365 EMA (long-term) on the 8-hour chart, confirming a bullish trend. Any violation below 199.35 indicates the intraday trend is weak. A dip to 198.78/198.40/197.70/196.70/196.25/195.25/194/193.70 is possible. Immediate resistance is at 200, a breach above this level targets 202/204.
Market Indicators (8-hour chart)
CCI (50)- Bullish
Directional movement index - Buy
Trading Strategy: Sell
It is good to sell on rallies around 199.58-60 with SL around 200.50 for a TP of 198/197.40.



FxWirePro: EUR/ NZD dips below lower range, bearish bias increases
FxWirePro: EUR/AUD downward momentum remains in place
FxWirePro: GBP/NZD extends decline , vulnerable to more downside
FxWirePro: GBP/AUD downside pressure builds, key support level in focus
EUR/JPY Bulls Hold the Line Above 185: Eyes Locked on 188 Breakout
Pound-Yen Roars Back Above 214: Bulls Reload for 216–217 Charge on Dip-Buying Setup
Ethereum Tumbles Below $2K: Bears Eye $1,700 as All Key EMAs Flip Red
FxWirePro: GBP/AUD downside pressure builds, key support level in focus
Aussie Yen Breaks 114 Barrier: Bulls Lock Horns With Resistance, Eyes on 115 Summit
FxWirePro- Major Pair levels and bias summary
FxWirePro- Major Crypto levels and bias summary
FxWirePro: GBP/USD recovers some ground but bears are not done yet
FxWirePro: USD/CNY bears maintain upper hand
FxWirePro- Woodies pivot (Major)
FxWirePro: USD/CAD slips as Canadian dollar firms on hopes for US-Iran ceasefire deal 


