


 Goldman Sachs: US Dollar Likely to Stay Strong Despite Oil Price Retreat
  With Iran and the US signing a peace deal, where does that leave Benjamin Netanyahu?
  Trump’s Iran Strategy: What Has Been Achieved After Three Months of Conflict?
  How Donald Trump has changed the way diplomacy is done
  Gold's 365-Day EMA Streak Since Oct 2023 Faces Its First Real Test at $3,980 — Break or Bounce to $4,140?
  Gold Surges Above Key EMAs, Bulls Eye Resistance Amidst Bullish Momentum
  How AI prompting turned writerly description into an everyday skill
  J.P. Morgan Sees Potential Vestas Guidance Upgrade Amid Strong Wind Energy Demand
  Bank Regulation Rollbacks in the U.S. and UK Could Increase Financial Risks, Study Warns
  Today’s space race could turn fatal if we don’t agree on new rules
  China’s AI Manufacturing Boom Masks Weak Consumer Economy, Citi Says


 - EconoTimes)


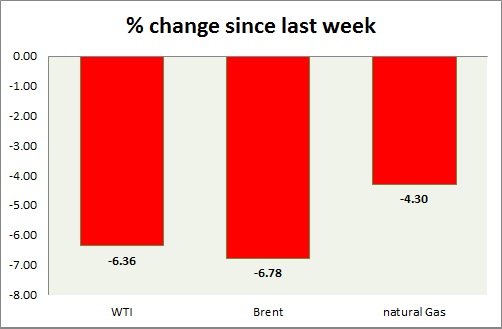
Energy pack is trading in red. Weekly performance at a glance in chart & table.
Oil (WTI) -
- WTI is sharply down today as key support at $43/barrel remains broken. Today's range $43.4-41.6
- Latest OPEC report showed cartel production at 31.4 million barrels/day.
- WTI is currently trading at $41.7/barrel. Immediate support lies at 38 area and resistance at $45, $47.5 area.
Oil (Brent) -
- Brent is down in line with WTI today, relatively worse performer. Today's range - $46-47.7
- Brent-WTI spread down from $3/barrel to $2.8/barrel.
- Brent is trading at $44.4/barrel. Immediate support lies at $42 area and resistance at $48, $50.5, 54 region.
Natural Gas -
- Natural gas dropped further, failing to break key resistance around $2.4/mmbtu. Today's range $2.22-2.31
- Natural Gas is currently trading at $2.25/mmbtu. Immediate support lies at $2, $1.85 area & resistance at $2.4.
|
WTI |
-6.36% |
|
Brent |
-6.78% |
|
Natural Gas |
-4.30% |


