


 SpaceX Stock Gets $175 Target as Analysts See Massive Growth Ahead
  Gold's 365-Day EMA Streak Since Oct 2023 Faces Its First Real Test at $3,980 — Break or Bounce to $4,140?
  With Iran and the US signing a peace deal, where does that leave Benjamin Netanyahu?
  AI Memory Boom Sparks Global Chip Supply Crunch
  J.P. Morgan Sees Potential Vestas Guidance Upgrade Amid Strong Wind Energy Demand
  Trump’s Iran Strategy: What Has Been Achieved After Three Months of Conflict?
  Sell the Bounce": Gold Rally Stalls Near $4165 as Fed Hawks Slam the Door on Rate Cuts — Targets $4000/$3600


 - EconoTimes)


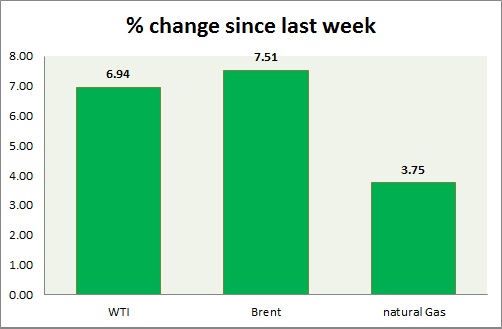
Energy performance is mixed in today's trading. Weekly performance at a glance in chart & table -
- Oil (WTI) - WTI selloffs continued as expected after key support level got broken. WTI has reached initial target of $42.5/ barrel. Today is sixth consecutive decline. WTI is currently trading at $43/ barrel, down nearly 2% today. Immediate support lies at 42 and resistance at 48.3.
- Oil (Brent) - Brent continued fall as concerns rise over new exports from Iran. Brent-WTI spread is trading at $ 9.6, support lies at $8 and resistance at $13. Brent has reached the initial target of $53. Price continued fall due to momentum but might remain capped as FOMC looms ahead. Brent is trading at $52.64/barrel. Immediate support lies at 53.2 & resistance at 58.4.
- Natural Gas - Natural gas bounced from support as prospect of an inventory crunch rose. Companies installing more natural gas capacity to generate electricity is leading to the crunch with addition of colder temperature. Last week inventory fell below 5 year average. Natural Gas is currently trading at 2.79/mmbtu. Price range is squeezing, there might be breakout ahead. Immediate support lies at 2.65 & resistance at 2.87.
|
WTI |
-4.25% |
|
Brent |
-2.99% |
|
Natural Gas |
3.31% |


