


 Sell the Bounce": Gold Rally Stalls Near $4165 as Fed Hawks Slam the Door on Rate Cuts — Targets $4000/$3600
  World Cup technology: from ref cams to AI analysts, cutting-edge research is changing the game
  Today’s space race could turn fatal if we don’t agree on new rules
  Gold's 365-Day EMA Streak Since Oct 2023 Faces Its First Real Test at $3,980 — Break or Bounce to $4,140?
  How Donald Trump has changed the way diplomacy is done
  Trump’s Iran Strategy: What Has Been Achieved After Three Months of Conflict?
  J.P. Morgan Sees Potential Vestas Guidance Upgrade Amid Strong Wind Energy Demand


 - EconoTimes)


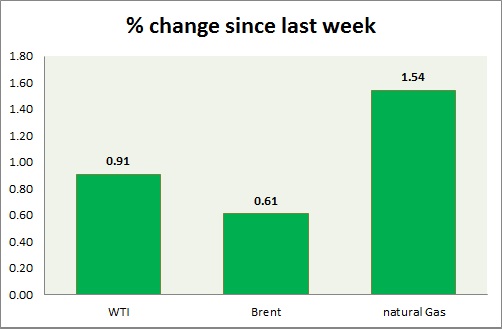
Energy segment is trading in green today. Weekly performance at a glance in chart & table.
Oil (WTI) -
- WTI shrugged off weakness and moved higher as dollar weakened across board, however failed to hold the gains as dollar recovered prior to New York session.
- WTI carved bearish doji in weekly chart. Further downside remains open if doji high is not taken out. RSI is also around 50 level resistance.
- WTI is currently trading at $59.9/barrel. Immediate support lies at $55-54.6, $51.2-50 and resistance at $63-$65. $58 may continue to provide interim support.
Oil (Brent) -
- Brent gained today taking cues from weak dollar. However Grave stone doji remain in play in daily chart. Nevertheless Brent might still gain further ground even if it fails to take out doji high.
- Brent-WTI spread gained around 30 cents, currently trading at $5.9/barrel. Further rise seems likely in favor of Brent. Focus is on weekly inventory report from EIA tomorrow.
- Brent is trading at $65.8/barrel. Immediate support lies at $63.7-63.2, 61.8-61.4 area and resistance at $ 70 region.
Natural Gas -
- Natural gas gained back after taking support around $2.78 due to weaker dollar.
- Downside bias has diminished significantly. Buy trades might be entered with small quantity.
- This year there could be higher intake for natural gas, as natural gas driven power plants rises in numbers in US.
- Price target for bulls are coming close to $3.5/mmbtu, should support at $2.45 holds. Averaging it as low as possible would diminish risk.
- Natural Gas is currently trading at 2.91/mmbtu. Immediate support lies at $2.72, $2.65, $2.44 area & resistance at $2.86.
|
WTI |
+0.91% |
|
Brent |
+0.61% |
|
Natural Gas |
+1.54% |


