


 With Iran and the US signing a peace deal, where does that leave Benjamin Netanyahu?
  Gold Surges Above Key EMAs, Bulls Eye Resistance Amidst Bullish Momentum
  Gold's 365-Day EMA Streak Since Oct 2023 Faces Its First Real Test at $3,980 — Break or Bounce to $4,140?
  How Donald Trump has changed the way diplomacy is done
  Morgan Stanley Sees Chinese Auto Market Recovery Gaining Momentum in Late Summer
  Trump’s Iran Strategy: What Has Been Achieved After Three Months of Conflict?
  How AI prompting turned writerly description into an everyday skill
  Silver Cracks Key 365-Day EMA for First Time Since Feb 2024; Bears Eye $50 on Rallies
  Today’s space race could turn fatal if we don’t agree on new rules
  World Cup technology: from ref cams to AI analysts, cutting-edge research is changing the game


 - EconoTimes)


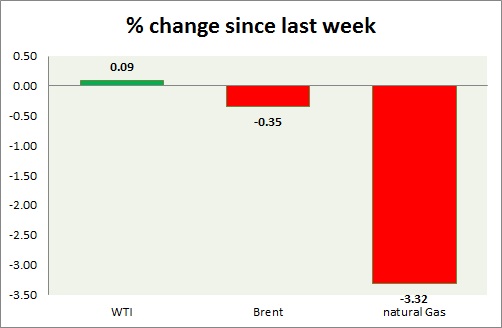
Energy pack is mixed today, while oil is up, gas is down. Weekly performance at a glance in chart & table.
Oil (WTI) -
- WTI is the best performer today, might be in the process of forming important bottom. Today's range $41.4-42.5
- WTI reached all of our anticipated target area. Reversal from here is possible.
- WTI is currently trading at $42.2/barrel. Immediate support lies at $42-40 area and resistance at $47-49 area.
Oil (Brent) -
- Brent is worse performer than WTI today. Today's range - $48.2-48.8.
- Brent-WTI spread dropped to $6.4/barrel, further contraction likely.
- Brent is trading at $48.6/barrel. Immediate support lies at $45 area and resistance at $53 region.
Natural Gas -
- Natural testing support area of $2.7, focus on inventory report Thursday. Today's range $2.67-2.74.
- Price might reach as low as $2.35 if it clears $2.7 mark, since bulls failed at $2.95 area.
- Natural Gas is currently trading at $2.71/mmbtu. Immediate support lies at $2.7, $2.55, $2.45 area & resistance at $2.95, $3.04, $3.32.
|
WTI |
+0.09% |
|
Brent |
-0.35% |
|
Natural Gas |
-3.32% |


