


 FxWirePro- Major Crypto levels and bias summary
  FxWirePro: GBP/USD hits one-month high, scope for further upside
  FxWirePro: EUR/AUD neutral in the near term, scope for downward resumption
  Crypto Major Pair Action Bias: ETHUSD Bullish as BTCUSD, SOLUSD & XRPUSD Stay Neutral
  FxWirePro: USD/JPY uptrend loses steam, remains on bullish path
  EUR/USD Holds Bullish Tone Despite Pullback from Yesterday’s High
  AUDJPY Bullish Surge: Strong Australian Dollar Fuels Fresh Upside as Pair Holds Above 113.50 and All EMAs Align
  FxWirePro- Major Pair levels and bias summary
  FxWirePro: EUR/AUD outlook weaker on renewed downside pressure
  ETH Stands Alone Bullish; BTC, SOL, XRP, BNB Neutral
  FxWirePro: NZD/USD trades in narrow range ,outlook bullish


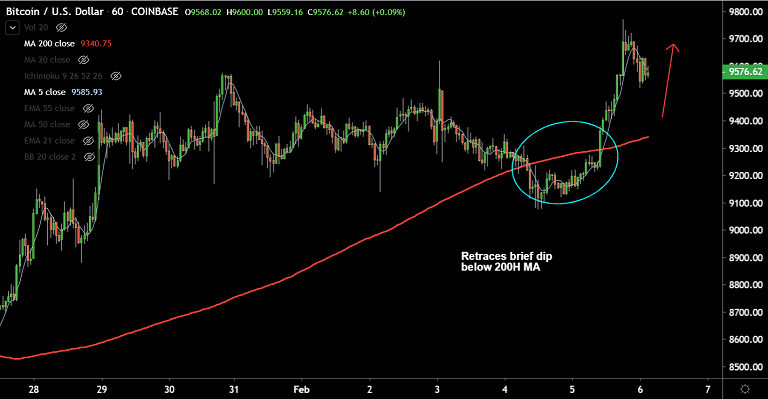
BTC/USD chart - Trading View
Exchange - Coinbase
Technical Analysis: Bias Neutral
GMMA Indicator: Major Trend - Bullish; Minor Trend - Bullish
Overbought/ Oversold Index: Overbought
Volatility: High and Rising
Support: 9401 (5-DMA); Resistance: 9715 (Trendline)
Bitcoin is consolidating previous session's gains. The pair has retraced brief dip below 200H MA and is on track to extend gains. BTC/USD was trading 0.32% lower on the day at 9583 at around 03:45 GMT.
Technical indicators are biased higher. The pair has temporarily paused at trendline resistance at 9715. Breakout will fuel further upside. MACD is well in the positive territory and positive DMI dominance and rising ADX support uptrend.
Major and minor trend as evidenced by the GMMA indicator are bullish. On the weekly charts, the shorter term moving averages have shown a bullish crossover on the longer-term moving averages. Long-term bias has shifted bullish for the pair. Minor corrections could be used to accumulate as Bitcoin is showing strong signs of bullish run.
Volatility is rising as evidenced by widening Bollinger bands. The pair has shown a breakout of sloping channel pattern. Break above 200-DMA has added to the bullish bias.
Scope for test of 61.8% Fib retracement at $11026. Hurdles on the way align at 10,000 (psychological mark) and 50% Fib at 10149. 5-DMA is immediate support at 9401. Retrace below 200-DMA (8857) could see significant weakness.


