
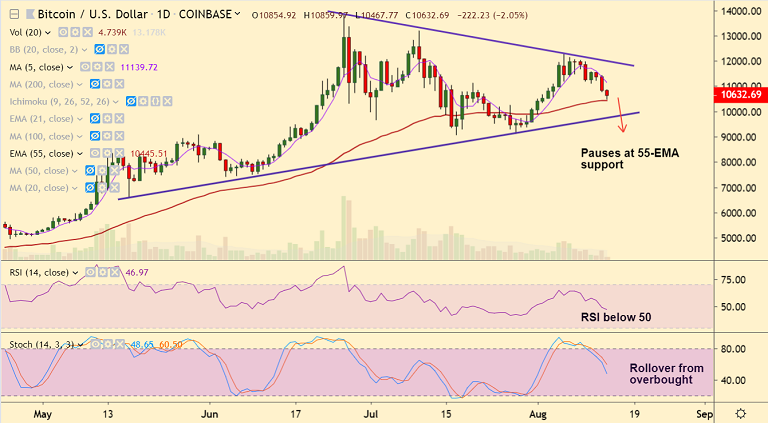
BTC/USD chart - Trading View
Exchange - Coinbase
Support: 10443 (55-EMA); Resistance: 10970 (21-EMA)
Technical Analysis: Bias Bearish
BTC/USD has slipped below daily cloud, scope for further weakness as technical indicators are turning bearish.
Stochs ans RSI are sharply lower and RSI has slipped below 50 level supporting further weakness.
MACD is on verge of a bearish crossover on signal line and -ve DMI crossover on +ve DMI adds to the bearish bias.
The pair is extending weakness for the 3rd straight session, trades 2.56% lower at 10577 at 03:45 GMT.
Price has broken below 4H 200-SMA and volatility is rising on the intraday charts.
Price action is currently holding support at 55-EMA at 10443, breach below will see test of trendline support at 9749.
Retrace above 21-EMA could negate near-term bearishness.


