
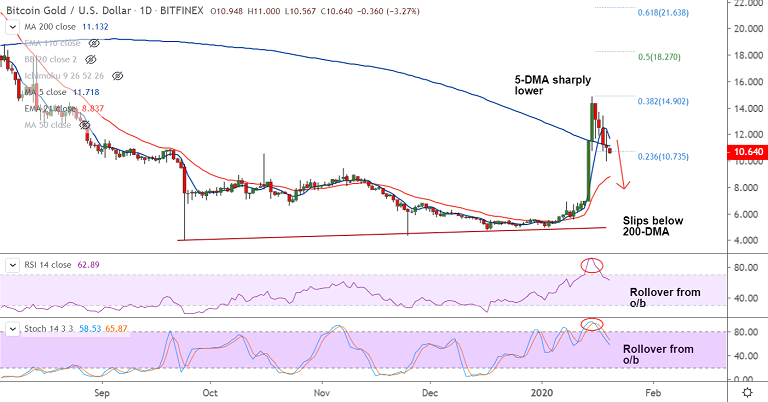
BTG/USD chart - Trading View
Exchange - Bitfinex
Technical Analysis: Bias Neutral
GMMA Indicator: Major Trend - Bullish; Minor Trend - Turning slightly bearish
Overbought/ Oversold Index: Neutral
Volatility: Shrinking
Support: 10.554 (200H MA); Resistance: 11.132 (200-DMA)
BTG/USD is extending weakness for the 5th straight session, near-term bias turning bearish.
The pair was trading 3.27% lower on the day at 10.640 at around 07:45 GMT, after closing 2.45% lower in the previous session.
Price action has slipped below 200-DMA and 5-DMA has turned sharply lower.
The pair has largely ignored 'Spinning Top' formation on the previous days candle and is extending weakness below 200-DMA.
Stochs and RSI have rolled over from overbought levels and are biased lower.
200H MA is holding strong support at 10.554. Break below will confirm more weakness.
Next major support lies at 21-EMA at 8.837. Break below 55-EMA (7.500) negates any upside bias.


