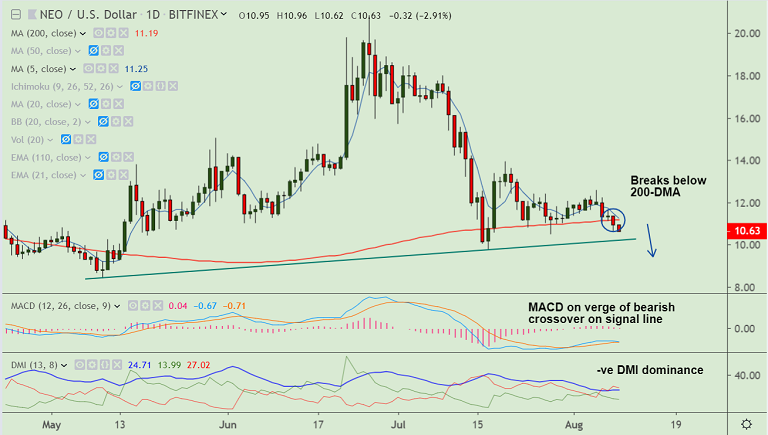
NEO/USD chart - Trading View
Exchange - Bitfinex
Support: 10.20 (trendline); Resistance: 11.19 (200-DMA)
Technical Analysis: Bias Bearish
NEO/USD has shown a breach below 200-DMA, opens up scope for further weakness.
Technical indicators support weakness. Stochs and RSI are sharply lower.
MACD is on verge of bearish crossover on signal line and -ve DMI dominance adds to the bearish bias.
GMMA indicator shows shift in major trend and Stochastics RSI is showing a rollover from overbought levels.
Price action is below major moving averages and recovery attempt has failed at 21-EMA resistance.
Next major support lies at 10.20 (trendline) ahead of 9.73 (July 17th low).
200-DMA has now turned resistance at 11.19. Breakout above 21-EMA (11.90) negates near-term bearishness.