
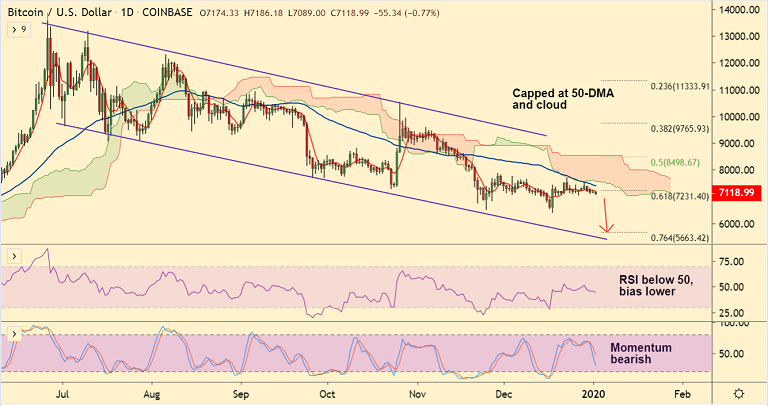
BTC/USD chart - Trading View
Exchange - Coinbase
Support: 6817 (Lower BB); Resistance: 7420 (50-DMA)
Technical Analysis: Bias Bearish
BTC/USD remains under bearish pressure as upside was rejected at 50-DMA and daily cloud.
The pair was trading 0.62% lower on the day at 7128 at 04:20 GMT after closing largely unchanged in the previous session.
On the weekly charts, failure by bulls to capitalize on the hammer formation suggests strong selling pressure.
The pair has resumed weakness with a 'Spinning Top' formation on the previous week's candle and was trading 3.54% lower in the current week till date.
On the hourly charts, price action remains capped below 200H MA and hourly cloud. MACD shows bearish crossover and ADX supports downside.
Technical studies are biased lower. Scope for resumption of weakness. Dip till trendline support at 6450 likely.
5-DMA is immediate resistance at 7210. Break above 50-DMA (7420) required for near-term upside.


