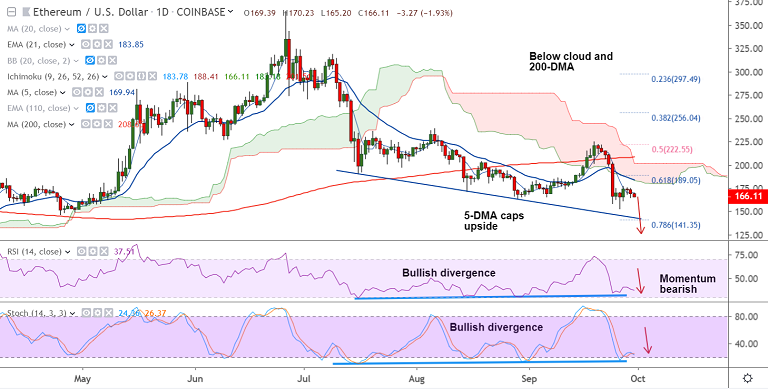
ETH/USD chart - Trading View
Exchange - Coinbase
Support: 151.98 (Lower BB); Resistance: 184 (nearly converged cloud and 21-EMA)
Technical Analysis: Bias Bearish
ETH/USD struggles to extend gains, retraces below 5-DMA, bias bearish.
The pair was trading at 167.30 at 05:20 GMT, down 1.23% at the time of writing.
Price action below cloud and 200-DMA, momentum with the bears.
Stochs and RSI are biased lower, RSI well below 50 mark which suggests strength in the downtrend.
MACD has slipped into the negative territory and ADX is rising in support of the current weakness.
Scope for test of lower Bollinger band at 151.98. Bullish divergence could limit downside.
Further weakness will see dip till 142 (nearly converged trendline and 78.6% Fib).
On the flipside, major resistance is seen at 184 (21-EMA and cloud base). Break above 200-DMA required for bearish invalidation.