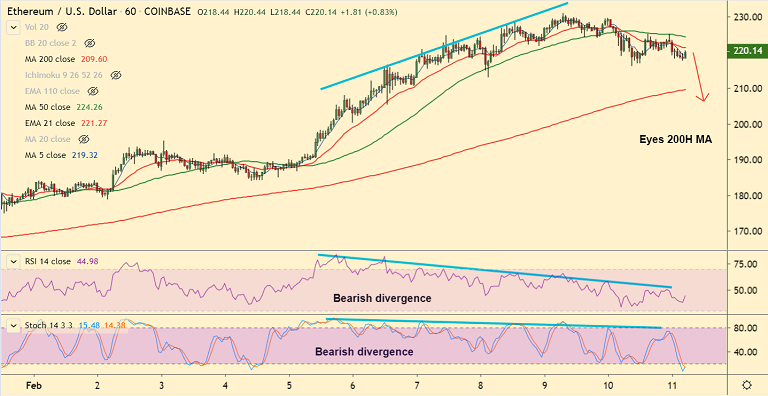
ETH/USD chart - Trading View
Exchange - Coinbase
Technical Analysis: Bias Neutral
Support: 209.59 (200H MA); Resistance: 223.44 (5-DMA)
ETH/USD was trading 1.68% lower on the day at 219.10 at around 05:20 GMT, after closing 2.60% lower in the previous session.
The pair has slipped below 5-DMA which is capping upside at 223.44. Intraday bias is neutral.
On the hourly charts, price action has slipped below 50H MA and now eyes strong support at 200H MA (currently at 209.59).
Oscillators are at overbought and on verge of rollover into neutral and 'bearish divergence' on the hourly charts adds to the bearish bias.
Major trend as evidenced by the GMMA indicator is bullish. Major trend reversal only below 200-DMA.
Break above 5-DMA and resumption of upside will see test of 61.8% Fib at 269.66.