


 FxWirePro- Major Pair levels and bias summary
  EUR/USD Holds Bullish Tone Despite Pullback from Yesterday’s High
  FxWirePro: NZD/USD trades in narrow range ,outlook bullish
  FxWirePro: USD/ZAR advances as South African rand weakens amid renewed Middle East tensions
  Crypto Major Pair Action Bias: ETHUSD Bullish as BTCUSD, SOLUSD & XRPUSD Stay Neutral
  NZDJPY Bullish Surge: Strong Kiwi Ignites Fresh Upside as 94 Support Holds and All EMAs Align
  FxWirePro:EUR/NZD dips below lower range, bearish bias increases
  Major Pair Action Bias: Extremely Bullish Surge Powers GBPUSD & NZDUSD as Bullish Momentum Ignites


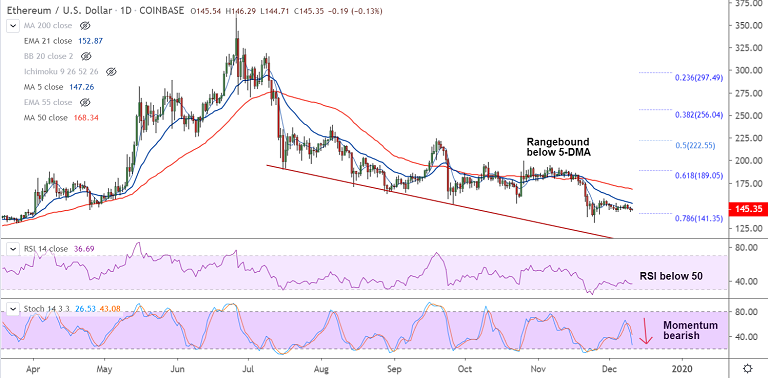
ETH/USD chart - Trading View
Exchange - Coinbase
Support: 141.35 (78.6% Fib); Resistance: 148.62 (20-DMA)
Technical Analysis: Bias Bearish
Ethereum was consolidating previous session losses, bias remains strongly bearish.
ETH/USD was trading rangebound on the day, at 145.36 at 10:55 GMT, after closing 1.19% lower in the previous session.
Bearish engulfing pattern on Monday's trade drags prices lower, Technical indicators support further weakness.
RSI is below 50 and Stochs are biased lower. MACD is well in the negative territory supporting the current downtrend.
Volatility is extremely low and Stochastics RSI is on verge of rollover from overbought levels, which if confirmed will plummet prices.
20-DMA is major resistance, which is capping upside at 148.62. An minor bullishness only on break above.
Immediate support is seen at 141.35 (78.6% Fib). Break below will see dip till 131.80 (Nov 25 low).


