
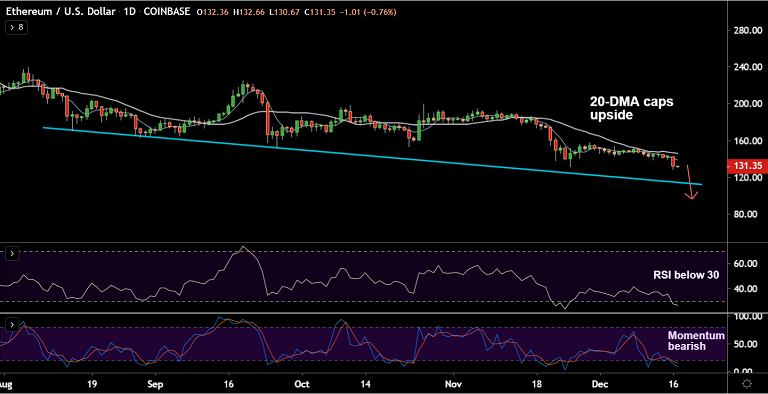
ETH/USD chart - Trading View
Exchange - Coinbase
Support: 115 (Trendline); Resistance: 138.54 (5-DMA)
Technical Analysis: Bias Bearish
ETH/USD is consolidating previous session's slump, scope remains strongly bearish.
The pair is consolidating previous sessions' weakness, trades largely muted at 131.72 at 05:40 GMT.
Bearish pressure intact, both major and minor moving averages are biased lower. Parabolic SAR also supports downside.
Volatility is rising, MACD in deep negative territory adds to the bearish bias. Bearish technical indicators are likely to drag the pair lower.
Stochs are sharply lower, RSI is well below 30 mark. Despite being in the negative zone, there are no signs of reversal.
Bearish resumption will likely see dip till trendline support at 115. Stiff resistance lies at 200H MA at 143.62. Break above will see a shift in near-term dynamics.


