ETH/USD chart - Trading View
Exchange - Coinbase
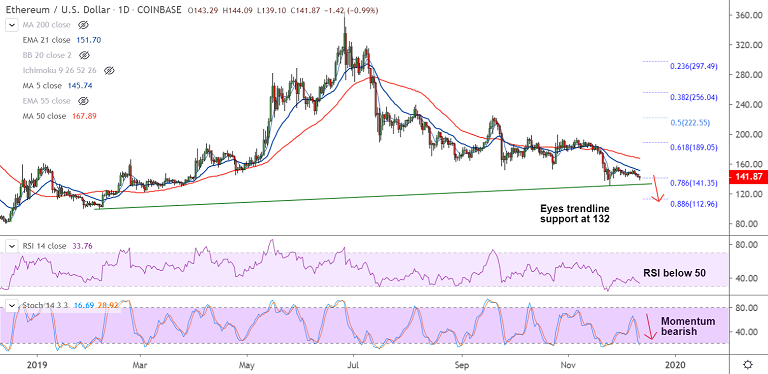
Support: 132 (Trendline); Resistance: 145.72 (5-DMA)
Technical Analysis: Bias bearish
ETH/USD is extending weakness for the 4th straight session, bias strongly bearish.
The pair has briefly dipped below the $140 mark to hit 2-week lows at 139.10, scope for further weakness.
Price has edged higher from lows at 139.10 and was trading 0.77% lower at 142.18 at 05:40 GMT.
Bearish engulfing pattern on Monday's trade to drag prices lower. MACD is well in the negative territory supporting the current downtrend.
Technical indicators are biased lower, Stochs and RSI are sharply lower. Rising volatility will add to the bearish bias.
Next major support is seen at 132 (trendline), violation there will open further downside. 20-DMA is major resistance at 148.11. Any minor bullishness only on break above.