


 FxWirePro: GBP/AUD drifts lower after BOE rate decision
  FxWirePro: AUD/USD gains some ground but outlook is bearish
  FxWirePro: USD/ZAR gains as stronger dollar outweighs upbeat South Africa's trade surplus
  FxWirePro: EUR/ AUD dips below 1.6400 level, focus on near term support
  US Magnificent 7 Stocks Trend Score: Amazon & Microsoft Hit Extreme Bullish (+100) as Meta Drops to -100 — Key Resistance & Support Watchlist
  FxWirePro- Major Pair levels and bias summary
  FxWirePro: GBP/USD rises as soft US data pressures dollar
  FxWirePro- Major Crypto levels and bias summary
  FxWirePro- Woodies pivot (Major)
  FxWirePro- Major Pair levels and bias summary
  NZDJPY Retreats on Yen Strength – Bearish Setup Targets 90 After Hitting 92.75 Low


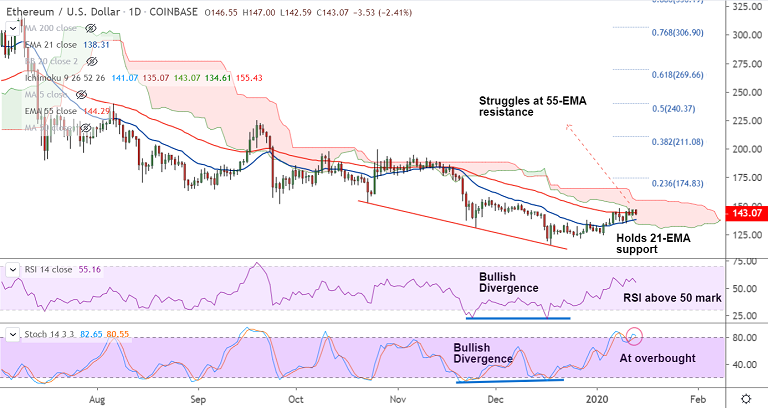
ETH/USD chart - Trading View
Exchange - Coinbase
Technical Analysis: Bias Neutral
GMMA Indicator: Major Trend - Bearish; Minor Trend - Neutral
Overbought/ Oversold Index: Overbought
Support: 138.36 (21-EMA); Resistance: 155.43 (Cloud base)
ETH/USD is extending choppy trade around 55-EMA, bias is neutral.
The pair was trading 2.06% lower on the day at 143.58 at 04:30 GMT, after closing 2.78% higher in the previous session.
The pair is currently holding above 21-EMA support at 135.60. Break below will accentuate weakness.
Major trend as evidenced by the GMMA indicator has been bearish. Long-term moving averages are biased lower.
Short-term moving averages are struggling to extend bullish streak, fail to break above longer-term moving averages.
On the hourly charts, the pair finds strong support around 200H MA (currently at 140.89).
Break below 200H MA and 21-EMA supports with turn in short-term MAs on the GMMA will see downside resumption.
Momentum is bullish, price action has broken into daily cloud, Stochs and RSI converge with price action along with a bullish divergence.
A decisive breakout at 55-EMA will see further gains. Scope then for test of 23.6% Fib at 174.83.


