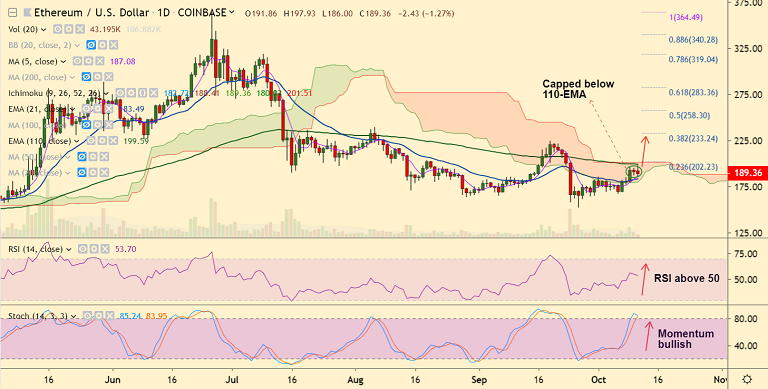
ETH/USD chart - Trading View
Exchange - Coinbase
Support: 183.44 (21-EMA); Resistance: 199.58 (110-EMA)
Technical Analysis: Bias Bullish
Ethereum is attempting to extend gains above 55-EMA, bias remains bullish, weakness only on close below.
The pair hit session highs at 197.93 before erasing all gains to slip into the red.
ETH/USD was trading at 188.82, down 1.47% at 05:35 GMT, close below 55-EMA could see weakness.
Price action has broken above 21-EMA and daily cloud base, raising scope for further upside.
Momentum studies on the daily charts are bullish, but at overbought levels. RSI is above 50 mark.
Focus remains on US-China trade talks this week. Potential currency pact between the two countries could hugely impact the cryptocurrency space.
Immediate resistance lies at 110-EMA at 199.58, while immediate support is at 21-EMA at 183.44.