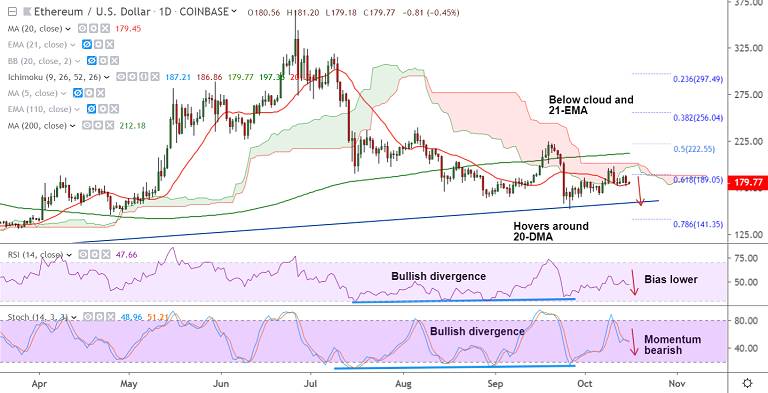
ETH/USD chart - Trading View
Exchange - Coinbase
Support: 167.50 (Oct 6 low); Resistance: 182.30 (21-EMA)
Technical Analysis: Bias Bearish
ETH/USD was trading 0.43% lower on the day at 179.81 at 06:25 GMT, intraday bias bearish.
The pair is extending previous session's weakness, hovers around 20-DMA support (179.44).
Technical studies have turned bearish on the intraday charts. Stochs and RSI are biased lower.
Major trend is bearish, decisive break below 20-DMA will see dip till 168 levels.
Bullish divergence could limit downside. Next major support below 167.50 (Oct 6 low) lies at 159.30 (trendline).
Breach below trendline support will see test of 78.6% Fib at 141.35. Bearish invalidation only above 200-DMA.