


 EUR/USD Holds Bullish Tone Despite Pullback from Yesterday’s High
  FxWirePro: USD/ZAR advances as South African rand weakens amid renewed Middle East tensions
  FxWirePro- Major Crypto levels and bias summary
  FxWirePro: GBP/USD under pressure despite UK's modest economic growth
  JPY Action Bias: Extremely Bullish Surge Ignites Across NZD, GBP & AUD
  AUDJPY Bullish Surge: Strong Australian Dollar Fuels Fresh Upside as Pair Holds Above 113.50 and All EMAs Align
  FxWirePro: USD/CAD falls after BoC rate hold and weak U.S. producer inflation
  FxWirePro: AUD/USD edges lower, but bullish outlook persists
  Crypto Major Pair Action Bias: ETHUSD Bullish as BTCUSD, SOLUSD & XRPUSD Stay Neutral


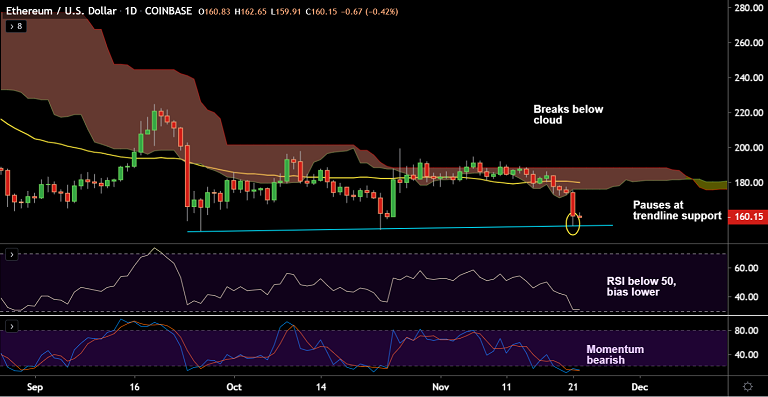
ETH/USD chart - Trading View
Exchange - Coinbase
Support: 155 (Trendline); Resistance: 169.66 (5-DMA)
Technical Analysis: Bias Bearish
ETH/USD is consolidating previous session's slump, bias strongly bearish.
The pair was trading at 159.56 at 05:50 GMT, down 0.83% at the time of writing.
Price action has shown a clear break below daily cloud raising scope for further weakness.
Downside has paused at strong trendline support at $155 mark, break below will see further weakness.
Technical indicators are biased lower, volatility is rising as evidenced by widening Bollinger bands.
However, oscillators are at oversold levels and price is extending below lower Bollinger band, some consolidation likely.
Break below trendline ($155) eyes next immediate support at 153 (Oct 23 low) ahead of 146 (Apr 25 low).


