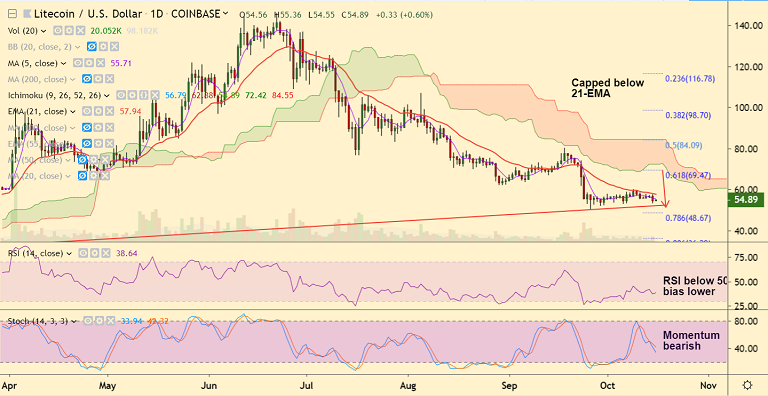
LTC/USD chart - Trading View
Exchange - Coinbase
Support: 52.25 (Trendline); Resistance: 57.93 (21-EMA)
Technical Analysis: Bias Bearish
LTC/USD slumped lower on Tuesday's trade, to close 4.06% lower at 54.56.
The pair is currently consolidating previous session's losses, bias remains bearish.
Major trend in the pair is bearish. Recovery attempts have been capped below 21-EMA.
Technical indicators have turned bearish. Stochastics RSI shows a rollover from overbought levels.
RSI is below 50 and biased lower. Stochs are sharply bearish. MACD is in the negative territory supporting downside.
Price is on track to test support at 52.25 (rising trendline), break below will accentuate weakness.
Violation at trendline support will drag the pair lower. Next major support lies at 78.6% Fib at 48.67.
Near-term upside only above 21-EMA. Bearish invalidation only above 200-DMA (88.02).