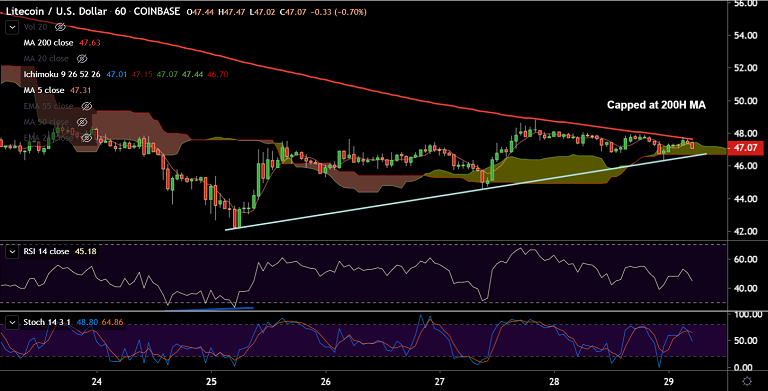
LTC/USD chart - Trading View
Exchange - Coinbase
Support: 46.70 (Hourly cloud base); Resistance: 47.64 (200H MA)
Technical Analysis: Bias Neutral to slightly bullish
LTC/USD is extending sideways grind for the 2nd consecutive session, bias neutral.
The pair is capped at 200H MA (currently at 47.64), break above will open upside for the pair.
Technical indicators on the intraday charts do not provide a clear directional bias.
Major and minor trend according to the GMMA are biased lower. Failure to break above 200H MA will see downside resumption.
Resistances for the pair align at 48.67 (78.6% Fib), 51.89 (21-EMA) and 53.58 (20-DMA).
5-DMA is immediate support at 46.86. Break below will see resumption of weakness, dip till 36.29 (88.6% Fib) likely.



FxWirePro: GBP/USD edged higher as hopes for US-Iran deal boost riskier assets
Bitcoin Buckles at $73,500: Middle East Tensions and Weak Institutional Demand Set Bearish EMA Stack on $70K Collision Course
Ethereum Cracks Below $2,000 as Bitcoin Contagion Bites—Bearish EMA Stack Sets Sights on $1,700
FxWirePro- Major Crypto levels and bias summary
NZD/JPY Breakout Blast: Kiwi Rocket Smashes 94.50 Resistance, Bulls Lock Sights on 95
FxWirePro: EUR/ NZD dips below lower range, bearish bias increases
FxWirePro- Major Crypto levels and bias summary
Bitcoin Bleeds $704M in ETF Outflows as Institutional Exodus Accelerates
FxWirePro- Major Crypto levels and bias summary
Ethereum Tumbles Below $2K: Bears Eye $1,700 as All Key EMAs Flip Red
FxWirePro: USD/JPY edges higher but bulls lack punch 


