
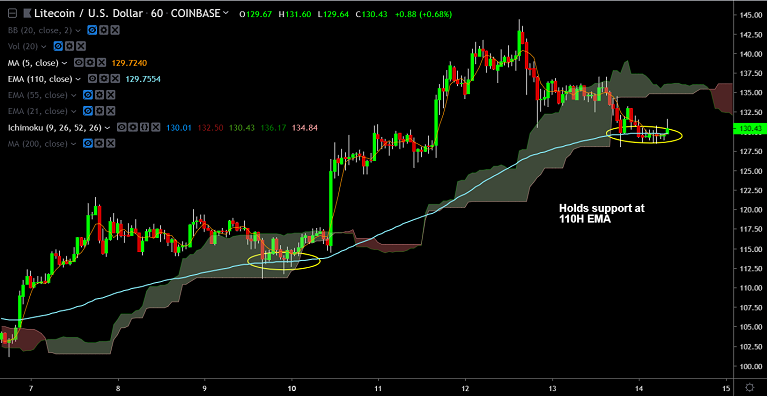
LTC/USD chart - Trading View
Exchange - Coinbase
Support: 129.75 (110H EMA), 122.58 (200H SMA)
Resistance: 132.82 (5-DMA), 137.28 (Upper BB)
Technical Analysis: Bias Bullish
LTC/USD has retraced brief dip below 129 mark, trades at 131.03 at 08:35 GMT.
The pair has paused downside at 'Channel top', break below will see further weakness.
Price action topped out with a 'Doji' formation at highs, major trend though still bullish.
Signs of near-term correction keeps scope for some more downside.
The pair has edged higher after some consolidation around 110H EMA which is offering support at 129.75.
Retrace into channel could see dip till 21-EMA at 116.51. Bullish invalidation only below 200-DMA.
Resumption of upside will see next bull target at 165 levels.
For details on FxWirePro's Currency Strength Index, visit http://www.fxwirepro.com/currencyindex.


