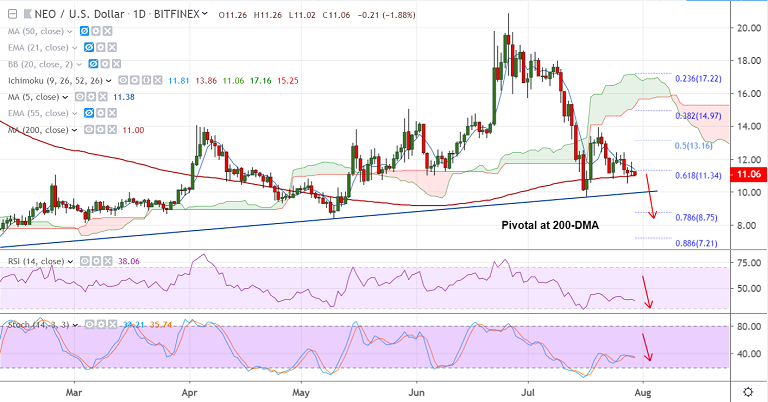
NEO/USD chart - Trading View
Exchange - Bitfinex
Support: 11 (200-DMA); Resistance: 11.38 (5-DMA)
Technical Analysis: Bias Bearish
NEO/USD grinds sideways along 200-DMA support. Break below will open up downside.
Technical studies have turned bearish on the daily charts.
Price action is well below cloud and major moving averages.
GMMA shows shift in trend with Short-term moving averages breaking below the Long-term MAs.
Further, we notice compression in the Longer-term moving averages with a shift lower suggesting downside.
The pair was unable to extend upside after 'Hammer' on July 28th trade. 'Doji' formation hampers upside.
Break below 200-DMA support (11.00) will open up downside. Next major support lies at 9.95 (trendline) ahead of 78.6% Fib at 8.75.
For details on FxWirePro's Currency Strength Index, visit http://www.fxwirepro.com/currencyindex.