


 ETH Stands Alone Bullish; BTC, SOL, XRP, BNB Neutral
  FxWirePro: USD/CAD falls to one-month low, scope for further downside
  FxWirePro- Major Pair levels and bias summary
  FxWirePro- Major Crypto levels and bias summary
  Major Pair Action Bias: NZDUSD Turns Bullish While Other Majors Stay Neutral
  CAD/JPY Surges on Broad-Based Canadian Dollar Buying
  FxWirePro- Major Pair levels and bias summary
  FxWirePro:EUR/NZD downside pressure builds, key support level in focus


 edges higher from session lows at 0.2154, 'Hammer' at lows raises scope for minor gains - EconoTimes)


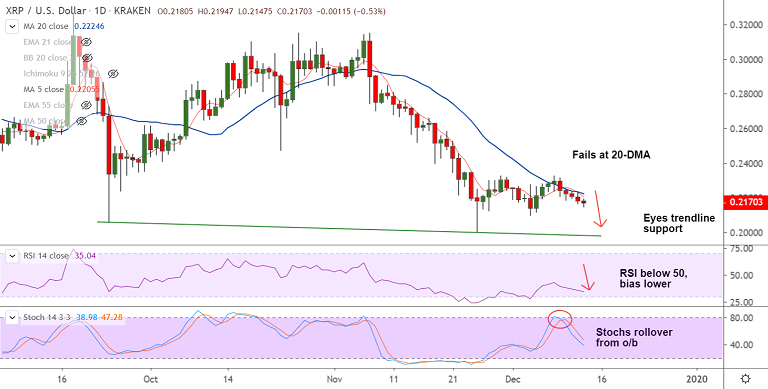
XRP/USD chart - Trading View
Exchange - Kraken
Support: 0.1975 (Trendline); Resistance: 0.2225 (20-DMA)
Technical Analysis: Bias Bearish
Ripple (XRP) is extending weakness for the 5th straight session, technical bias is strongly bearish.
XRP/USD was trading 0.49% lower on the day at 0.2171 at 10:30 GMT after closing 1.15% lower in the previous session.
The pair has edged higher from session lows at 0.2147 and a 'Hammer' formation on the 2H charts raises scope for upside.
That said, major and minor trend in the pair are bearish and technical indicators do not support upside as of now.
Lower Bollinger band offers immediate support at 0.2140. Scope for dip till trendline support at 0.1975.
5-DMA is immediate resistance at 0.2205. Break above eyes 20-DMA at 0.2225. Near-term bearish invalidation only above 21-EMA (0.2281).


