TRX/USD chart - Trading View
Exchange - Bitfinex
Technical Analysis: Bias Bullish
GMMA Indicator: Major Trend - Bullish; Minor Trend - Bullish
Overbought/ Oversold Index: Overbought
Volatility: High and Rising
Support: 0.02364 (5-DMA); Resistance: 0.02597 (weekly cloud)
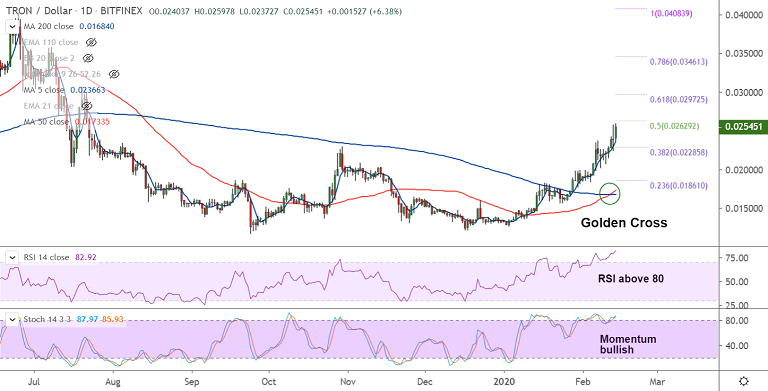
TRX/USD is extending grind higher, trades in the green for the 6th straight week.
Momentum studies are bullish, Stochs and RSI are in the higher overbought zone.
Volatility is high and rising on the daily charts. Bollinger bands are widening on the weekly charts.
'Golden Cross' confirmed on the daily charts raises scope for further upside. Major and minor trend are bullish.
Weekly cloud offers strong resistance at 0.02597, break above required for further gains. Next hurdle aligns at 61.8% Fib at 0.02972.
5-DMA is immediate support at 0.02365. Break below 200-DMA negates bullish bias.