


 FxWirePro- Major Pair levels and bias summary
  AUDJPY Bullish Momentum Ignites: Buy Dips Toward 115 Target
  FxWirePro- Major Crypto levels and bias summary
  FxWirePro: USD/ZAR firms slightly, but downward resumption looks likely
  FxWirePro- Woodies pivot (Major)
  FxWirePro- Major Crypto levels and bias summary
  FxWirePro: AUD/ USD eases as risk sentiment remains fragile
  GBPJPY Bullish Surge: Strong Pound Ignites Fresh Upside on Fed-BOE Policy Divergence as All EMAs Align
  NZDJPY Bullish Surge: Strong Kiwi Ignites Fresh Upside as 94 Support Holds and All EMAs Align
  Major Pair Action Bias: Extremely Bullish Surge Powers GBPUSD & NZDUSD as Bullish Momentum Ignites
  FxWirePro- Major Crypto levels and bias summary


 offers stiff resistance - EconoTimes)


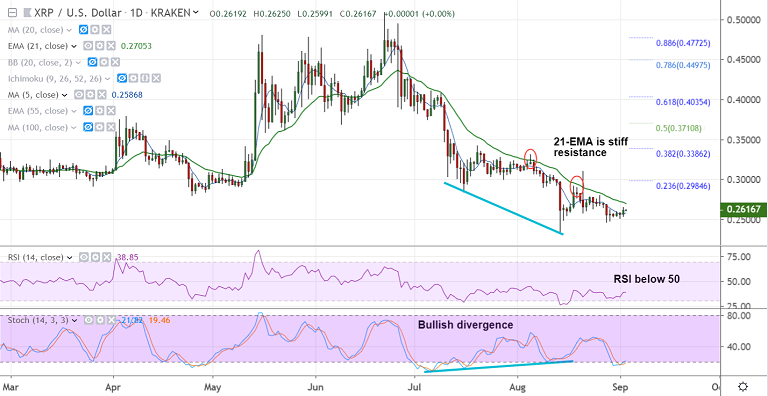
XRP/USD chart - Trading View
Exchange - Kraken
Support: 0.2586 (5-DMA); Resistance: 0.2705 (21-EMA)
Technical Analysis: Bias Bearish
XRP/USD extends sideways grind, consolidates break above 200H SMA.
The pair is trading in a major bear-trend as indicated by GMMA indicator.
Volatility is low and the pair finds stiff resistance at 21-EMA at 0.2705.
RSI is well below 50 and Stochs are at oversold levels. Price action is below cloud and major MAs.
A bullish divergence keeps scope for some upside in the pair. Breakout above 21-EMA could see minor gains.
Retrace below 200H SMA (0.2603) support will see resumption of weakness. Retest of 0.2335 (Aug 14 low) likely.


